The below is from a recent edition of the Deep Dive, Bitcoin Magazine's premium markets newsletter. To be among the first to receive these insights and other on-chain bitcoin market analysis straight to your inbox, subscribe now.
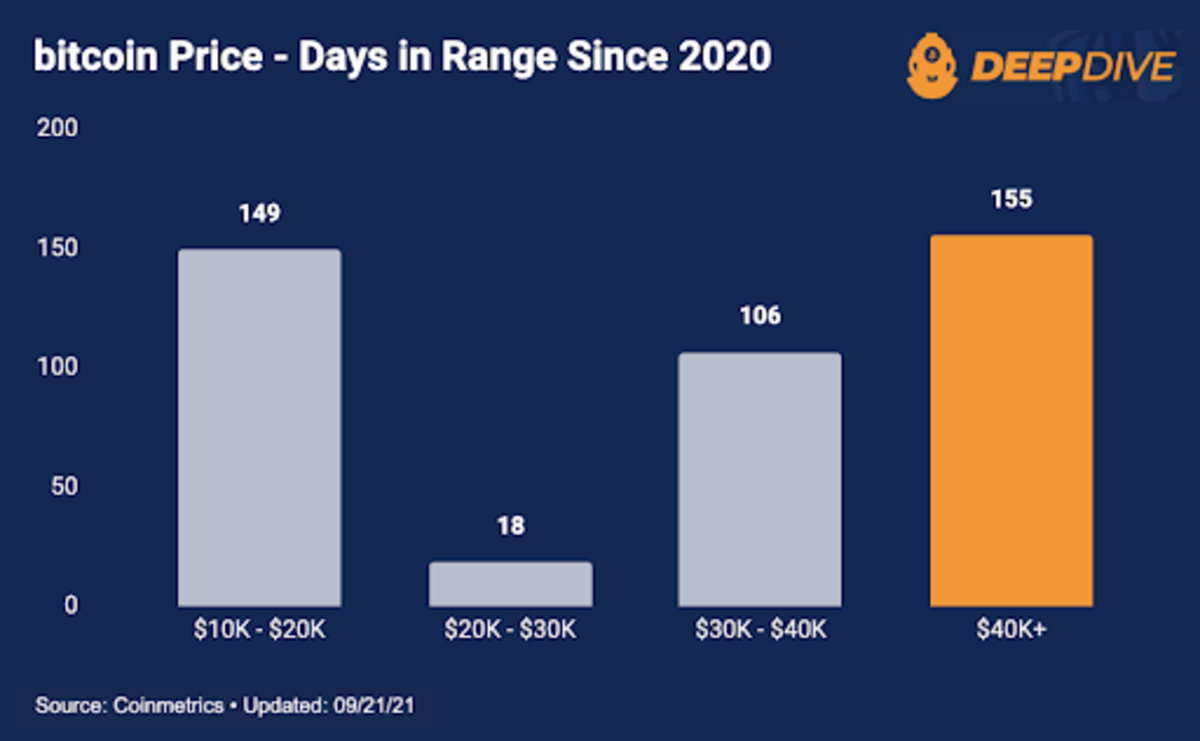
The $40,000-plus range has been a key psychological level for the bitcoin price. Since the start of 2020, the bitcoin price has existed at or above $40,000 for 155 days, or 36% of the time. Since all of those 155 days happened in 2021, the price has existed at or above $40,000 on 59% of the days of this year. To dig in further, we can use the UTXO realized price distribution data to get some better context on Monday's price decline and how the $43,460 closing price fits within the bigger picture.
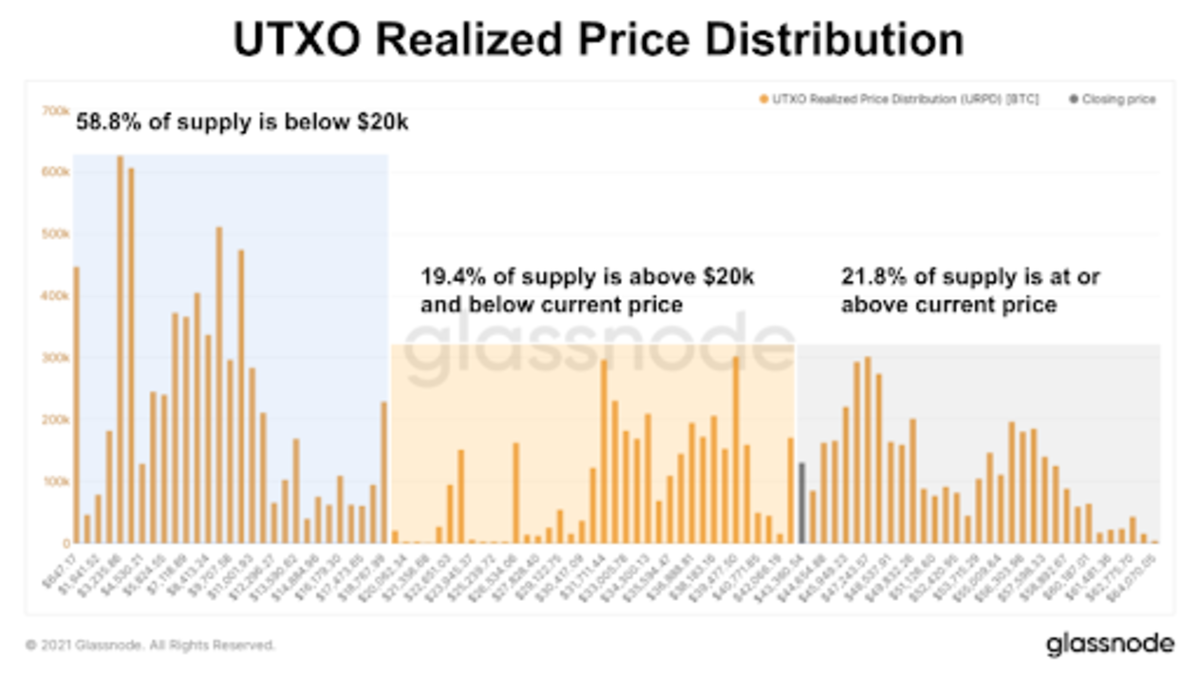
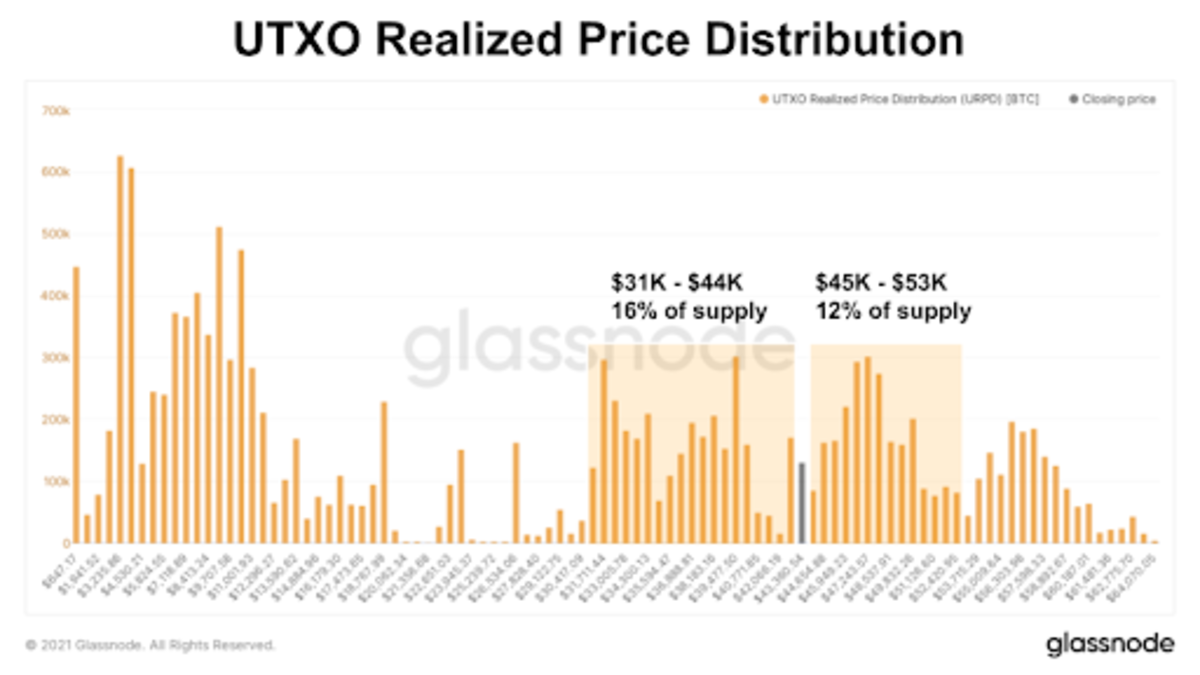
Currently, 21.8% of supply is at or above the closing price level, showing a significant amount of interest for bitcoin changing hands at a higher range. On the other side, 19.4% of supply is above $20,000 and below the closing price with strong support built up in the $31,000 to $43,000 range. Roughly 25% of bitcoin supply exists above $40,000.
Each bar in the charts shows the amount of existing bitcoin that last moved within that price range. For bitcoin to drop below $40,000, we would have to see a significant sell-off in the market with many short-term investors realizing losses alongside a bigger structural change to long-term holders that accumulated in that 19.4% supply middle range.

Source: Glassnode

Source: Glassnode

Source: Coinmetrics
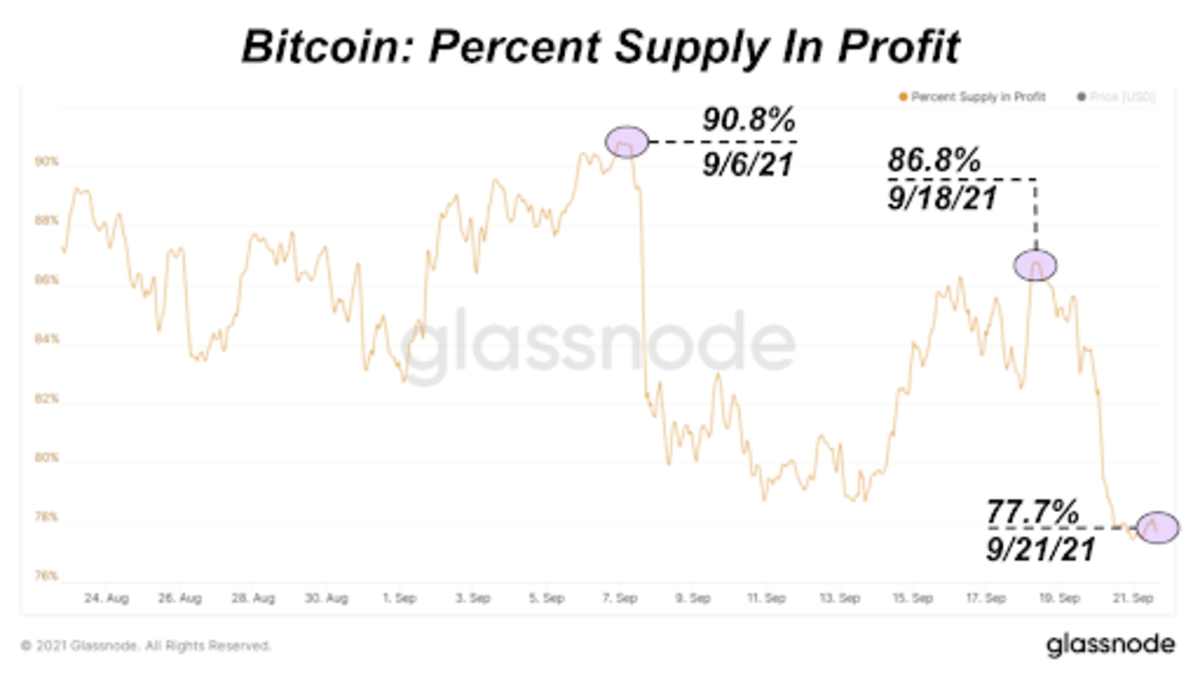
Another way to view potential losses in the market is through the percentage of bitcoin supply in profit. Over the last few weeks, the percentage supply in profit has dropped 13% with most of that decline happening last night. We saw much lower levels at 66% back in July this year right before the 70% price increase from $29,000.

Source: Glassnode
If we do see a further bitcoin price move to the downside in the short term, there looks to be plenty of room for long-term holders in the market to absorb it. This week, we're keeping a close watch on derivatives market dynamics and macroeconomic conditions.


