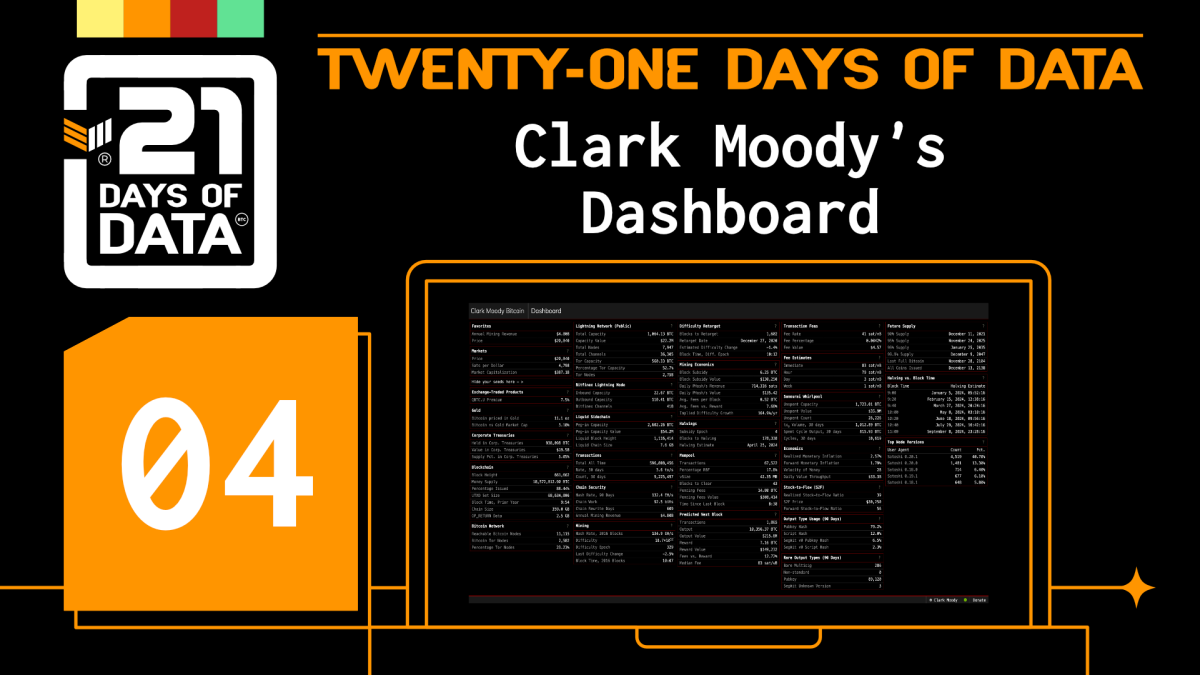
Clark Moody has been a long-time staple of the Bitcoin analytics and visualizations community. In fact, Bitcoin Magazine’s first article mentioning Moody goes all the way back to August 2013. From mining to Liquid, Moody’s dashboard gives a great point-in-time visual representation of what’s happening on Bitcoin.
Flip sat down with Moody to talk through his process for deciding which data to present, plans on integrating layer two protocols, and (of course) bitcoin in space.
Also, Moody has created a second visualization, focused on tracking price tickers across different exchanges and futures markets. Although not as popular as his dashboard (yet), it's a great screen to keep up on your second monitor to track price discrepancies between exchanges.


