- Bitcoin has embarked on a spectacular rally over the past few months.
- After bottoming in the $3,000s in the March, the asset surged as high as $12,500.
- Bitcoin currently trades for $10,700, still far above where it was in the March crash.
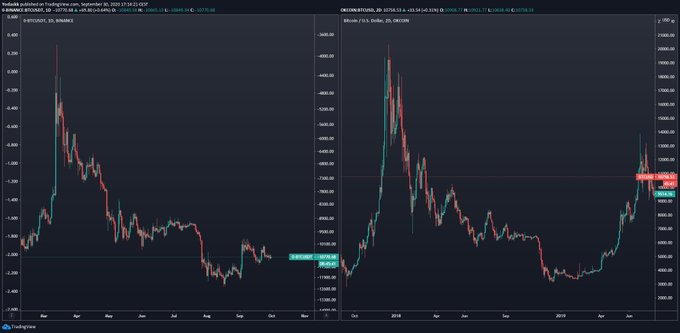
- A fractal predicts that the asset may soon undergo a strong bearish reversal.
- This comes in spite of on-chain trends that suggest the proverbial Bitcoin ball is in the court of bulls.
Bitcoin Fractal Predicts a Strong Correction In the Near Future
Bitcoin could soon see a strong reversal, predicts an eerie inverse fractal pattern observed by a crypto-asset trader.
The trader recently shared the chart below, which shows that Bitcoin’s inverse price action since the February highs looks similar to the macro price action from the 2017 bubble. This fractal comparison suggests that the cryptocurrency will soon drop towards the $6,000-7,000s as bears take over once again.
Chart of BTC's price action (inverse) over the past few months (from Feb) on the left and chart of Bitcoin macro price action on the right.
Chart/fractal made by Coiner-Yadox (@Yodaskk on Twitter). Chart from TradingView.com
It’s worth noting that the analyst that shared this fractal is one that has shared historically accurate charts.
For one, at the end of August, he predicted that the leading cryptocurrency would drop to $9,700 in the weeks after his analysis. This was when Bitcoin was trading around $12,000, meaning he was one of few suggesting such a drop would take place.
The reason why he expected a retracement was that price action was trending bearish and there was a confluence of technical supports in the range he specified.
His prediction proved to be mostly accurate as Bitcoin proceeded to drop from the $12,000 region it was at to $9,800 over the span of a week.
Should history rhyme, Bitcoin may be poised to undergo a strong retracement in the weeks ahead.
On-Chain Trends Supporting Bulls
On-chain trends are supporting bulls, though.
Willy Woo, a prominent on-chain analyst, recently commented on the trends of the underlying Bitcoin network:
“We’re seeing a spike in activity by new participants coming into BTC not yet reflected in price, it doesn’t happen often. This is what traders call a divergence, in this case it’s obviously bullish.”
We're seeing a spike in activity by new participants coming into BTC not yet reflected in price, it doesn't happen often. This is what traders call a divergence, in this case it's obviously bullish.
Chart by @glassnode pic.twitter.com/WrQueYL9up
— Willy Woo (@woonomic) September 30, 2020
Corroborating this further, the hash rate of the Bitcoin network has continued to march higher despite short-term weakness.
The hash rate of the Bitcoin network has regularly been testing and setting new all-time highs over recent weeks as more mining machines come online.
This suggests that BTC miners are committed to the long-term growth of the network and see value in turning on more machines.
Featured image from Shutterstock
Price tags: xbtusd, btcusd, btcusdt
Charts from TradingView.com
Scary Inverse Fractal Predicts a Bitcoin Correction Is Imminent


