
Bitcoin is trading above the $100,000 mark after several days of consolidation just under $105,000. The market remains uncertain as bulls attempt to push higher, while bears anticipate a potential retracement. The debate is intensifying: some analysts argue that a massive expansion is only a matter of time, while others suggest a healthy correction could be due before the next leg up.
New data from CryptoQuant adds depth to the current picture. According to the firm, the Short-Term Holder Market Value to Realized Value (STH MVRV) ratio currently stands at 1.09. This indicates that short-term holders are in moderate profit, but not yet at a level that typically triggers heavy selling. However, historical patterns suggest that the first significant wave of profit-taking often begins near an MVRV of 1.25 — which correlates to a Bitcoin price of around $118,000. A stronger wave tends to occur around 1.35, roughly at the $128,000 level.
At the current average growth rate, these MVRV milestones could be reached by early and late June, respectively. For now, all eyes are on Bitcoin’s next move as sentiment swings between breakout optimism and cautious profit management.
STH MVRV Forecasts Key Sell Zones As Bitcoin Holds Above $100K
Bitcoin is now facing a crucial technical test, with the $100,000 level acting as a key support zone that could determine the market’s next major move. Bulls must defend this area to confirm a strong bullish structure and maintain the momentum that has carried BTC over 40% higher since the April 9th low. After rallying more than 12% last week alone, Bitcoin has now spent over five weeks in a sustained uptrend, but the battle isn’t over yet.
If Bitcoin can hold above $100K and clear supply pressure near $105K, many analysts believe a breakout into price discovery could follow. Momentum is building, but the next steps will be decisive. According to CryptoQuant analyst Axel Adler, on-chain metrics provide additional clues. The current STH MVRV (Short-Term Holder Market Value to Realized Value) ratio sits at 1.09, signaling modest profitability for short-term holders — a necessary condition for sustainable uptrends.
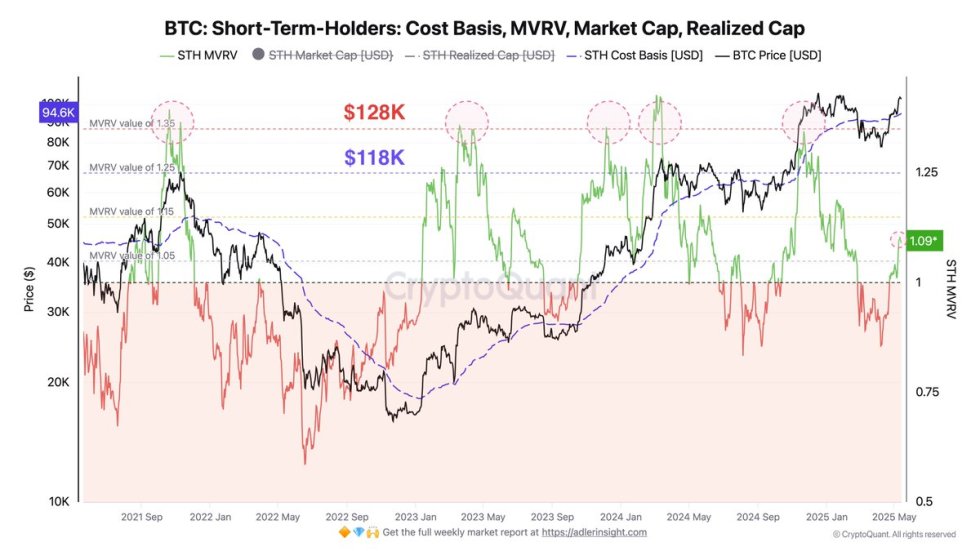
However, significant selling pressure is often triggered when the MVRV reaches 1.25 (target ≈ $118K) and intensifies around 1.35 (≈ $128K). If the current growth rate holds, these levels could be reached by early and late June, respectively. Adler emphasizes that these projections are linear, meaning real momentum could either accelerate or slow based on macro and market sentiment.
For now, Bitcoin remains in a bullish structure, but eyes are on how it navigates this key zone. A clean push above $105K could spark a wave of new demand, while any weakness below $100K may shift sentiment quickly.
Technical View: Price Testing Crucial Demand
Bitcoin is currently trading near the $101,765 level after facing strong rejection just below the $105,000 resistance zone. The chart shows that BTC has entered a consolidation range after a sharp rally from April lows, with price action repeatedly testing the $103,600–$105,000 area without a confirmed breakout. This zone now acts as a critical resistance that bulls must clear to resume the uptrend and push toward price discovery above the previous all-time high.
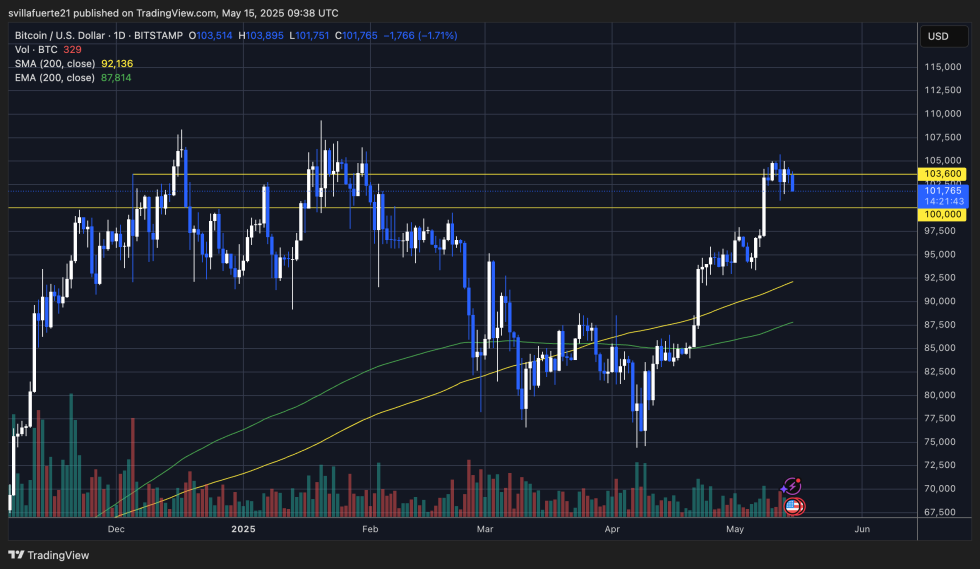
On the downside, the $100,000 mark has emerged as a key psychological and technical support. A breakdown below this level could trigger further downside toward the $95,000 region, which also aligns with the previous consolidation structure from early May. However, volume remains relatively muted compared to the breakout candles in early May, suggesting this current retrace could be temporary unless supported by growing sell pressure.
The 200-day EMA (green) and SMA (yellow) are well below the current price, supporting the bullish structure in the mid-term. However, if BTC continues to reject at local highs without renewed volume and momentum, traders may begin to reassess risk.
Featured image from Dall-E, chart from TradingView