The below is from a recent edition of the Deep Dive, Bitcoin Magazine's premium markets newsletter. To be among the first to receive these insights and other on-chain bitcoin market analysis straight to your inbox, subscribe now.
In today’s Daily Dive, we will cover some of the estimated accumulation and distribution trends of whale and retail entities. There’s many different ways to define what makes an entity “retail” or “whale.”
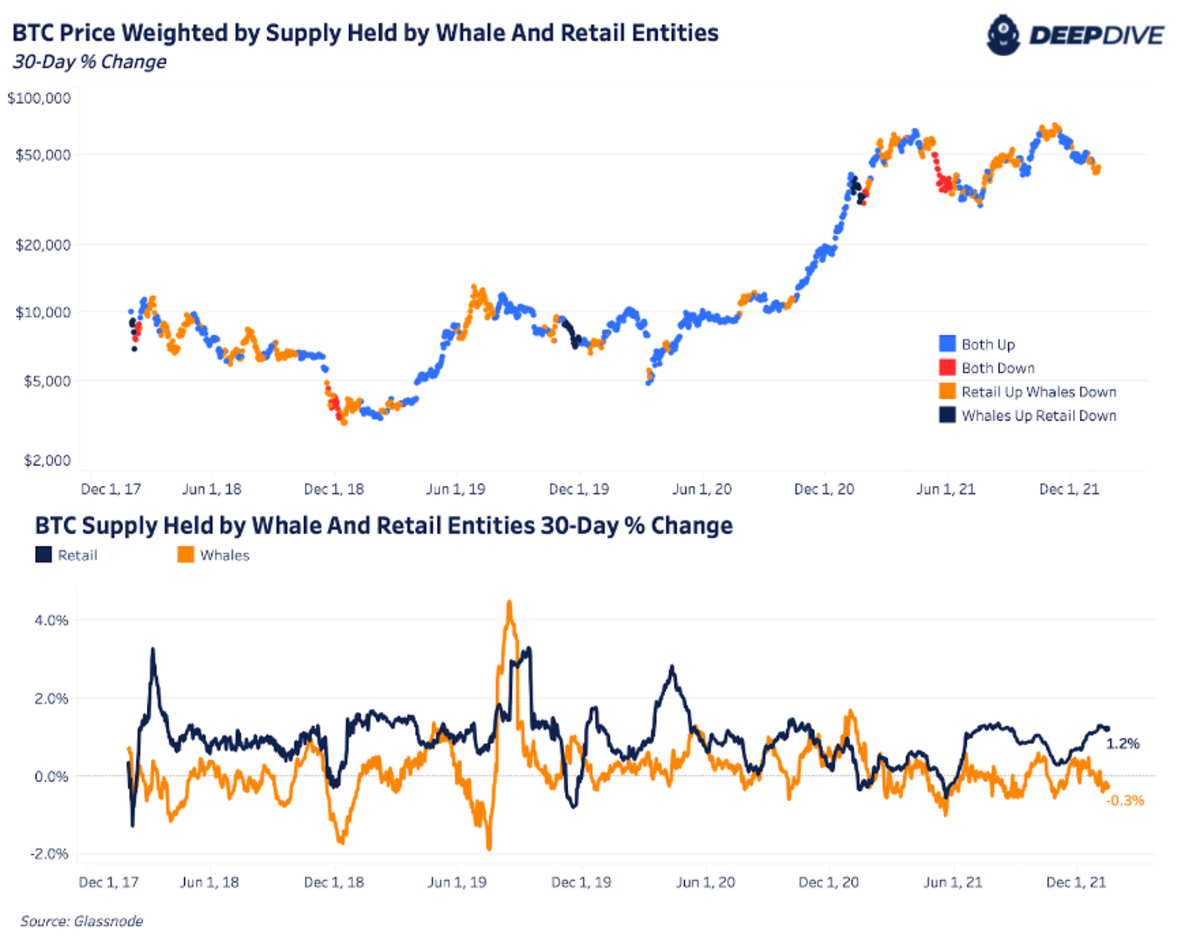
In this analysis, we’re defining retail as the bitcoin supply held by entities under 10 BTC, i.e., that looks at the behavior of any entity holding less than 10 BTC. We’re defining whales as the bitcoin supply held by entities above 10 and below 10,000 BTC. Glassnode’s data science heuristics helps define and determine different entities.
What can be useful is to look at the 30-day percentage change across these groups to understand, at a high-level view, the rate at which retail or whale groups are adding or selling bitcoin. The below chart shows the periods when the supply of both groups is increasing, decreasing or going in opposite directions:

Source: Glassnode
Currently, we’re seeing a strong accelerating trend of retail buying over the last two months while whale supply is slightly declining. The best sign (in blue) is to see both groups adding to their bitcoin supply signaling stronger demand. Typically over the last year, there have been sustained periods of retail adding bitcoin at local tops while whales were selling.
Although a smaller share of circulating supply, we’re seeing some of the fastest acceleration in retail supply under 0.1 BTC that we’ve seen over the last few years. Retail tends to always be accumulating with not many periods of distribution.


