- Bitcoin is surging higher after holding in the high-$11,000s for a number of days.
- As of this article’s writing, the leading cryptocurrency trades for $12,150.
- Although this is not much higher than the breakout zone at $12,000, analysts are optimistic about what’s next for the market.
- This rally was predicated on a surge of spot market volume, adding fuel to the case for upside.
- BTC is expected to move to $13,000 next, which is around where the next level of macro resistance lies.
- Bitcoin’s ongoing rally seems to be influenced by a similar move higher in the value of gold.
Bitcoin Is Primed to Move Even Higher Than It Has
Bitcoin is primed to move even higher after breaching the pivotal $12,000 resistance, according to analysts. This is due to how important $12,000 has been to BTC’s price trajectory over recent weeks, acting as a rejection point for three separate rallies.
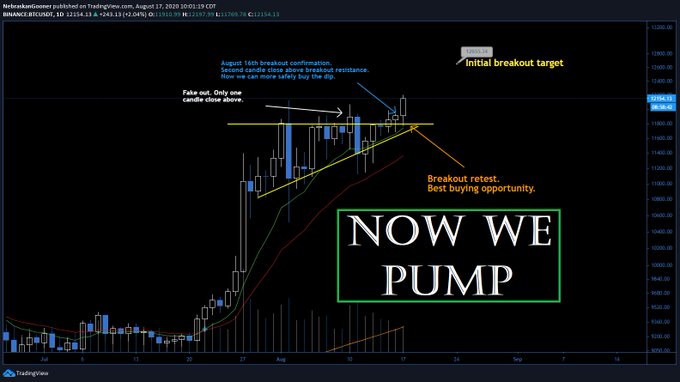
One trader shared the chart below as BTC began to scale higher on Monday morning. It shows that BTC has confirmed an ascending triangle, a textbook chart pattern often seen by analysts are bullish.
The breakout suggests a move to $12,600, the trader who shared the chart below explained.
Chart of BTC's price action over recent weeks with an ascending triangle analysis by trader 'Nebraskangooner' (@Nebraskangooner on Twitter). Chart from
TradingView.com
Others are targeting $13,000.
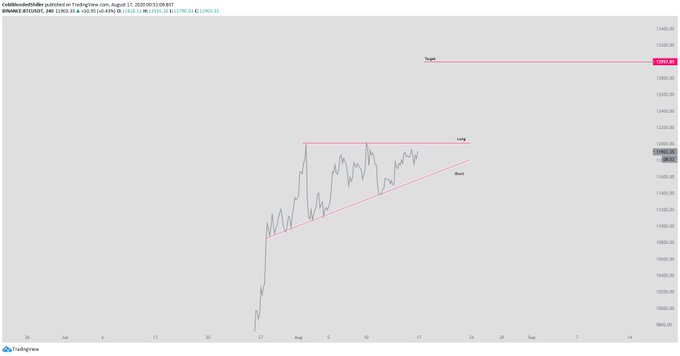
As reported by Bitcoinist previously, another trader shared the chart below. It shows a different iteration of the ascending triangle, and it predicts that Bitcoin will move towards $13,000 on the breakout.
Chart of BTC's price action over the past few weeks with an analysis by trader Cold Blooded Shiller (@ColdBloodshill on Twitter). Chart from TradingView.com
Little Resistance Until $13,000
$13,000 seems to be the level that many are targeting as there is little technical resistance until that level.
One historically accurate trader recently commented that $13,000 is in Bitcoin’s scopes. This came after he predicted last week’s retracement would bottom in the $11,100 region:
“Lots of liquidity still above us. And the monthly support is still support. Short term I think 11900 is possible. But as you know, mid term I’m still aiming at 13k. Let’s see how much we can get.”
This was echoed by Eric “Parabolic/King” Thies, a cryptocurrency analyst and indicator creator. He said that there is little macro resistance until $13,300:
“$BTC 1M Chart. Current price $12,025. Resistances at $13.3k -> $14.5k -> $17.1k -> $19.5k. Bull run starts at new ATH… $20,000. Lets ride.”
Featured Image from Shutterstock
Price tags: xbtusd, btcusd, btcusdt
Charts from TradingView.com
Here's Why Bitcoin Is Primed to Move Towards $13,000


