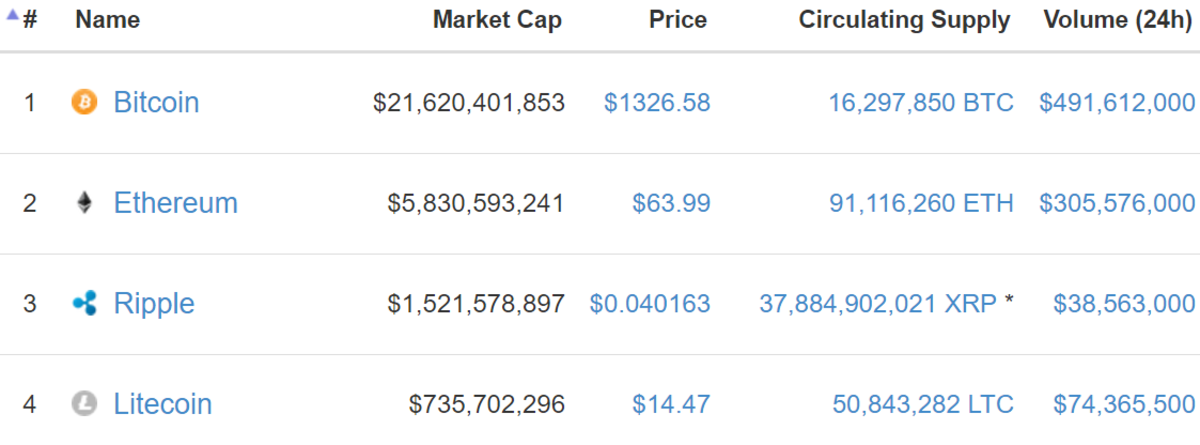
As Bitcoin breaks its own all-time high (ATH) on multiple exchanges, it appears as though a rising tide raises all boats.
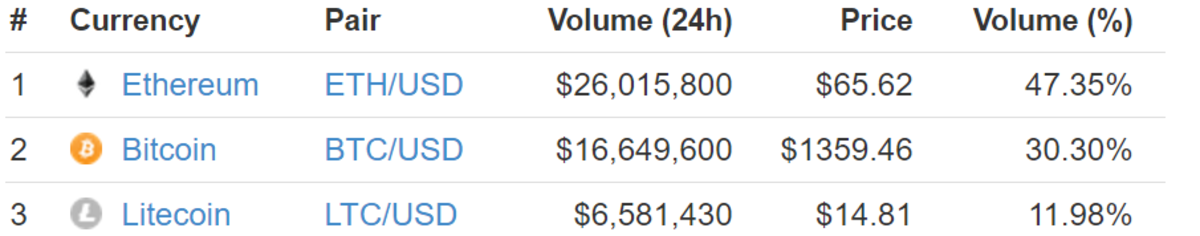
Most important, GDAX/Coinbase, a crucial on/off ramp for digital currencies, has taken the lead in ETH/USD volume and is reporting higher ETH/USD than BTC/USD volume over the past 24 hours.
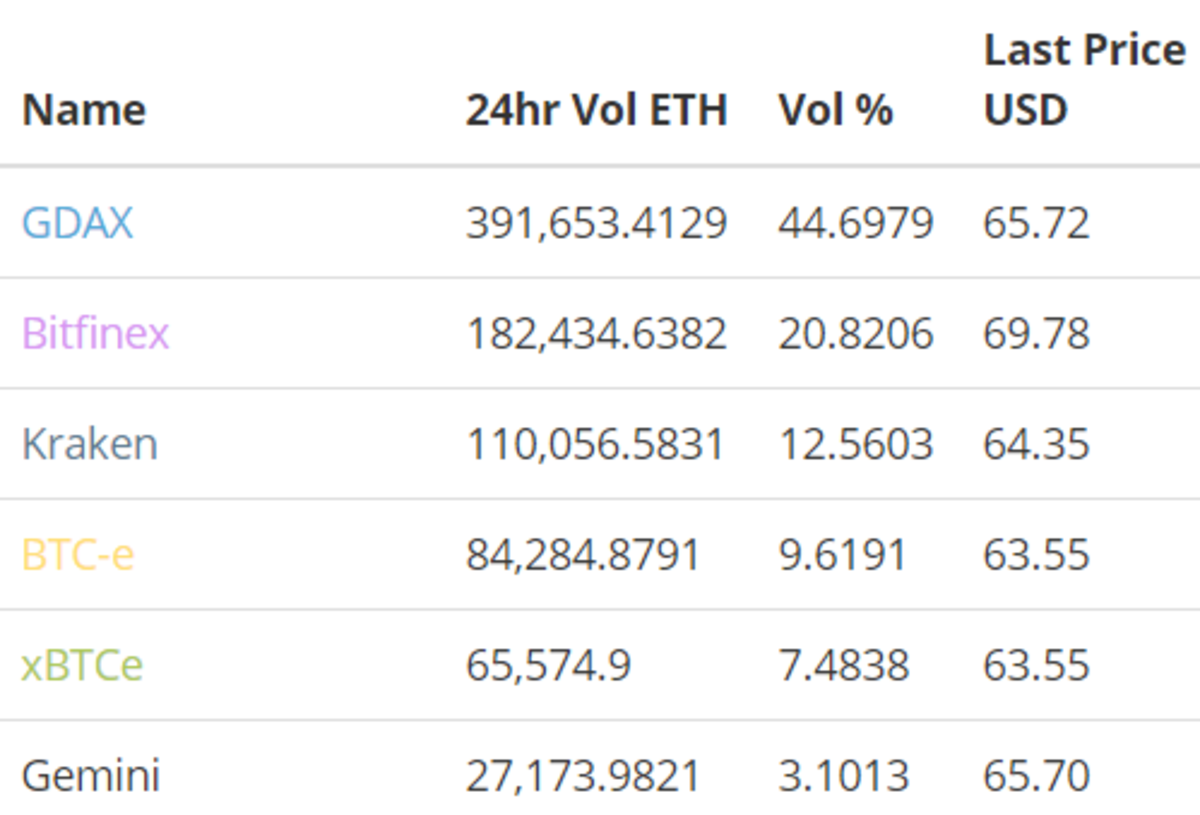
This is anecdotal evidence for a key metric of “new money” coming into the space. Although the $4–5 premium remains on Bitfinex due to USD withdrawal halt, GDAX now leads in volume and holds a small premium above a few of the other exchanges as well. Poloniex and ETH/BTC volume continue to lead globally (not shown).
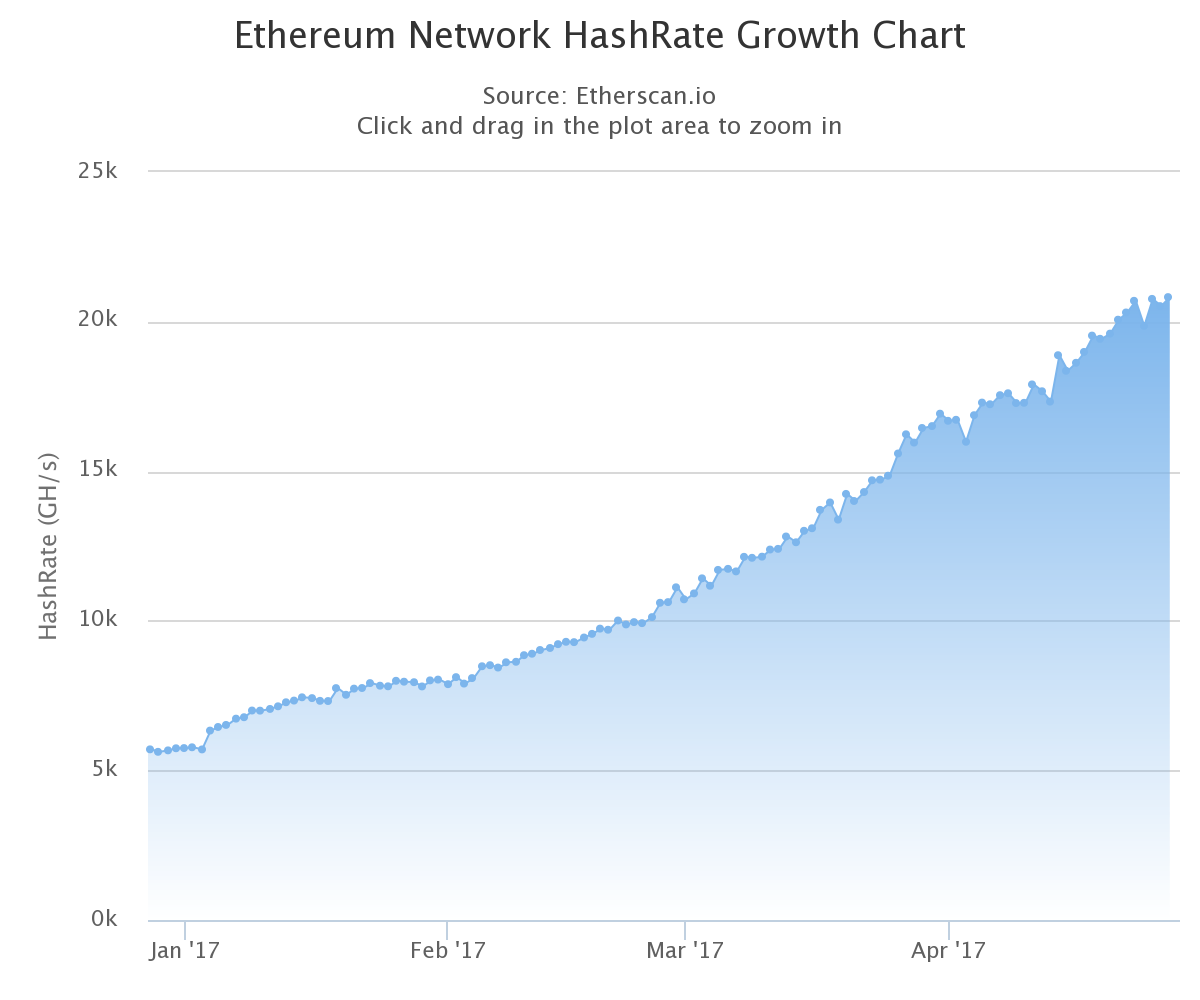
Ethereum hash rate also continues to push ATHs almost daily, showing strong confidence in miner support.
For weeks now, I’ve been watching the slow formation of the head and shoulders bearish reversal chart pattern. The pattern convincingly formed with the appropriate and important descending volume profile.
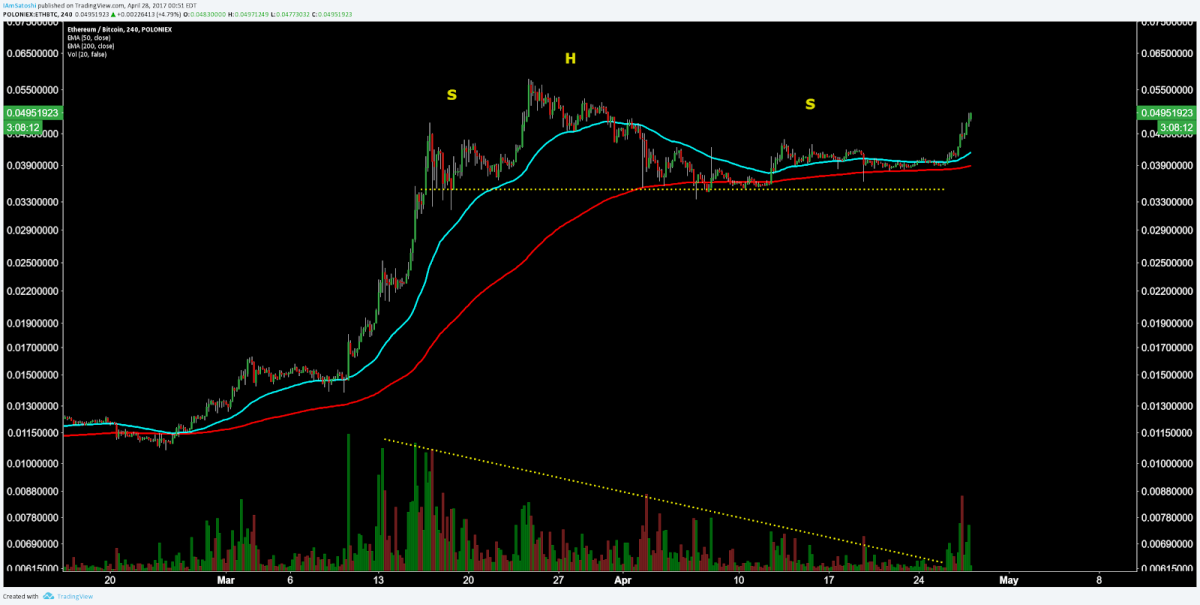
The trick with trading these patterns is to not jump the gun. The short entry signal is always a break of the horizontal support on volume. That never happened. Instead, price held above the 200 EMA and refused a bearish 50/200 EMA cross as well. When reversal patterns form and do not play out as expected, that is generally considered to be a strong continuation sign.
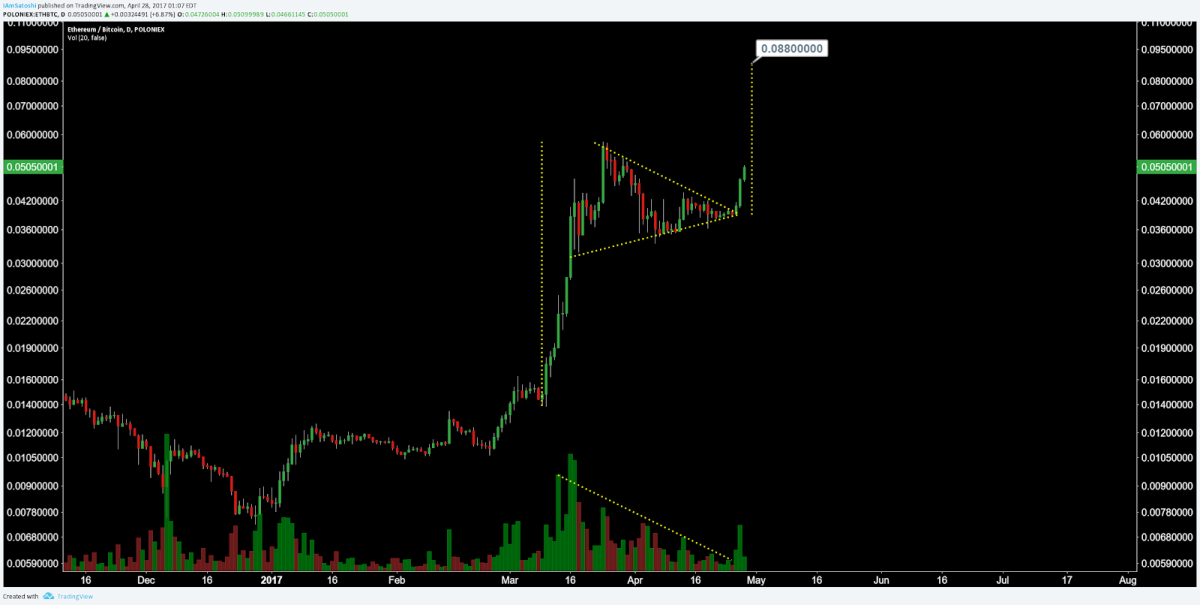
It’s also possible that this was simply a bullish continuation pennant all along, with a measured move target of ~$115 (0.088).
Going forward, we should watch for price to test previous local highs and push for the 1.618 Fibonacci extension, yielding a target of ~$115 (0.0873).
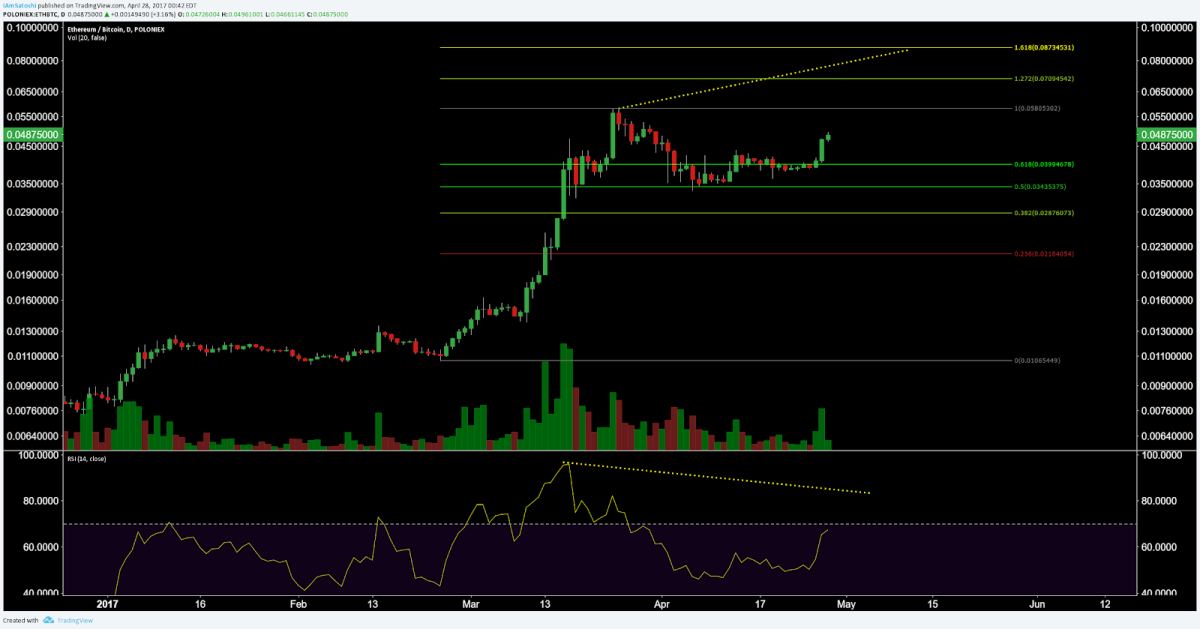
There is also a high probability that a higher high in price will not yield a higher high on the Relative Strength Index (RSI), a momentum oscillator. Although this result is days or a few weeks away at this point, watching out for this now will prevent you from entering a trade based on emotions. Sure, price can go parabolic at any time and break the rules of divergences, but should a divergence form, it suggests continuation is far less likely than reversal. We will also want to be watching volume. If volume does not break previous local highs, it adds to the bearish divergence confluence, all of which would suggest bullish momentum is waning.
Summary
- As Bitcoin breaks ATHs, it’s likely that any digital currency on associated on-ramps increases as well, simply by association.
- Bitfinex ETH/USD premium continues and should continue until USD withdrawals resume, if ever.
- Although chart patterns and indicators were leaning bullish, price did not break down and is now projecting a target of ~$115.
- Watch for the new Ethereum ATH to occur and create a bearish divergence with a swift pullback in price.
Trading and investing in digital assets like bitcoin is highly speculative and comes with many risks. This analysis is for informational purposes and should not be considered investment advice. Statements and financial information on Bitcoin Magazine and BTCMedia related sites do not necessarily reflect the opinion of BTCMedia and should not be construed as an endorsement or recommendation to buy, sell or hold. Past performance is not necessarily indicative of future results.