On-chain data shows Bitcoin miners have held strong and not dumped the coin despite the recent uncertainty due to the Russian invasion of Ukraine.
Bitcoin Miners Show Diamond Hands As They Continue To Hodl
As pointed out by an analyst in a CryptoQuant post, the BTC miner reserve hasn’t observed any significant falls recently despite the uncertainties surrounding the financial markets.
The “miner reserve” is an on-chain indicator that measures the total amount of Bitcoin stored in the wallets of all miners.
When the value of this metric increases, it means BTC miners are transferring a net amount of coins to their reserve.
An uptrend over a long period of time can suggest Bitcoin miners may be in a phase of accumulation at the moment.
On the other hand, when the indicator’s value goes down, it implies BTC miners are transferring their coins out of their wallets, possibly to exchanges. So, this trend can be a sign of dumping from these original whales.
Related Reading | Interview With Aarika Rhodes On Bitcoin, Universal Basic Income (UBI), And Removing Dinosaurs From Washington
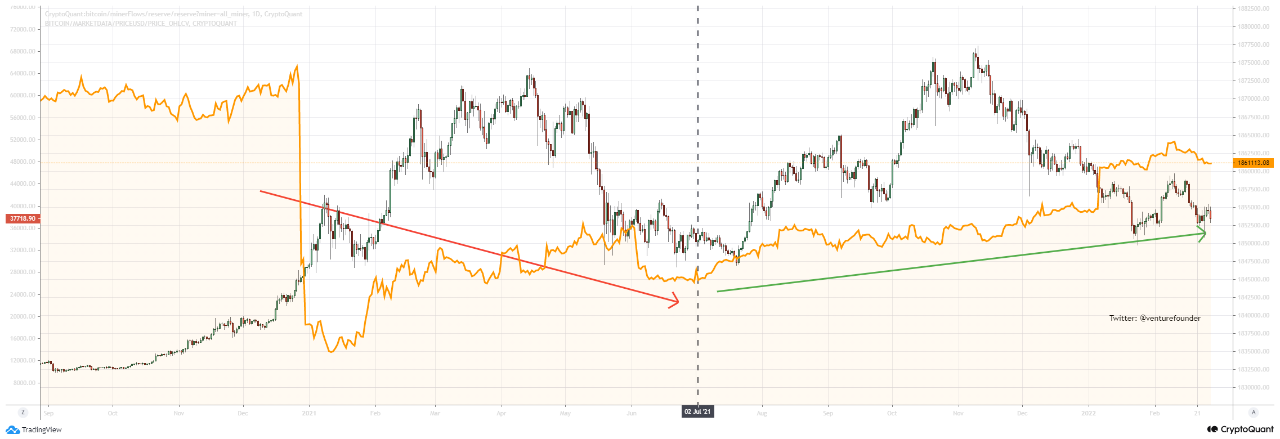
Now, here is a chart that shows the trend in the BTC miner reserve over the last couple of years:

Looks like the value of the indicator has been going up since a while | Source: CryptoQuant
As you can see in the above graph, the Bitcoin miner reserve showed a big drop at the start of the 2021 bull run, as miners dumped the crypto and harvested their profits.
However, since July 2021, the metric again seems to have caught some uptrend, showing that miners are accumulating right now.
Related Reading | Ukrainians Are Getting $3K More For Bitcoins As Cash Withdrawal Limits Imposed
Interestingly, the reserve has been mostly trending sideways recently, with a very small drop just this week. This is while the market has been surrounded by the uncertainty caused due to the Russian invasion of Ukraine.
It means that Bitcoin miners have shown diamond hands despite the rest of the market panic selling. Miners have historically been one of the major sources of selling pressure, so them holding strong can be bullish for the price.
BTC Price
At the time of writing, Bitcoin’s price floats around $38.5k, up 2% in the last seven days. Over the past month, the crypto has accumulated 3% in gains.
The below chart shows the trend in the price of the coin over the last five days.

BTC's price seems to have mostly moved sideways over the past few days | Source: BTCUSD on TradingView
Multiple times over the last couple of days, Bitcoin looked to be approaching a retest of the $40k level, but the coin failed before it could make an attempt.
Featured image from Unsplash.com, charts from TradingView.com, CryptoQuant.com


