On-chain data shows Bitcoin miners have continued to accumulate as their reserves have now reached a yearly high.
Bitcoin Miner Reserves Now Stand At Highest Value For 2021
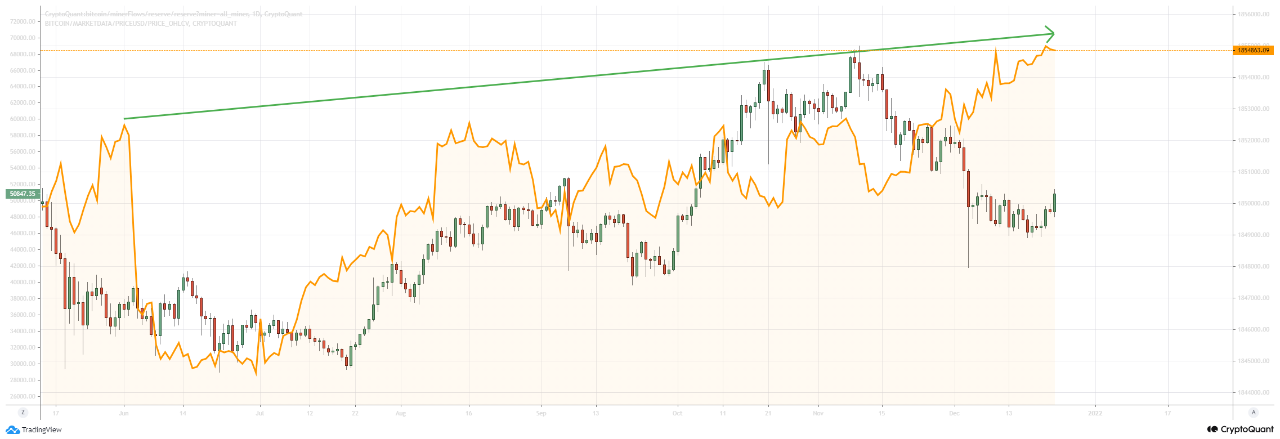
As pointed out by a CryptoQuant post, BTC miners have been continuing the trend of accumulation for a while now as their reserves recently broke the 2021 high set around 6 months ago.
The “miner reserves” is an indicator that shows the total amount of Bitcoin currently stored in wallets of all miners.
When the value of this metric goes down, it means miners have started to send their coins to other places, usually to exchanges. Such a trend, when prolonged, may imply that miners have now started to dump their crypto. This could prove to be bearish for the price of BTC.
On the contrary, when the reserve rises in value, it implies miners could be in a state of accumulation as they are pilling up their coins in their wallets. Naturally, this trend can be bullish for BTC.
Related Reading | Elon Musk Replies To Dorsey’s Bitcoin Maximalism, “That’s Why I’m Pro Doge”
Now, here is a chart that shows how the value of this BTC indicator has changed over the past six months:

Looks like the value of the miner reserve has been trending up | Source: CryptoQuant
As you can see in the above graph, the Bitcoin miner reserves seem to have surpassed the yearly high set around six months ago.
While miners did have some phases of distribution, the net trend during the period has been that of accumulation.
Related Reading | Bitcoin Hashrate Down 8% From ATH, What’s Behind The Decline?
This trend may show that miners are currently bullish on BTC as they now hold more coins than they did when the crypto reached the all-time high of $69k.
Historically, miners have been net spenders as they are considered to be the ones to bring selling pressure to the market. However, data has now revealed that the behavior of these traditional sellers has now shifted to being that of hodling.
Due to supply-demand dynamics, this switch of the miners from being distributors to accumulators can drive Bitcoin’s scarcity up, and benefit the price of the crypto.
BTC Price
At the time of writing, Bitcoin’s price floats around $51k, up 8% in the last seven days. Over the past month, the crypto has lost 11% in value.
The below chart shows the trend in the price of BTC over the last five days.

BTC's price has shown strong momentum up in the last few days | Source: BTCUSD on TradingView
Bitcoin had been stuck in consolidation between the $45k and $50k price levels for quite the while, but now that the crypto has broken past $51k again, the stagnation might be coming to an end.
Featured image from Unsplash.com, charts from TradingView.com, CryptoQuant.com


