Bitcoin’s volatility has been eerily low over recent weeks.
As Bitcoinist has covered extensively, indicators tracking the metric have plunged to multi-month lows as BTC has been caught between $8,500 and $10,000.
On July 3rd, a trader shared the image below, showing Bitcoin’s historical volatility index (one-day, BitMEX) over the past two years. The chart shows that the index is at its lowest value since the end of March 2019.

BTC’s implied volatility is also at lows not seen since March 2019.
The width of the Bollinger Bands, another measure of volatility, is also at multi-month lows. The Bollinger Bands are a classic technical indicator often used to signal important levels and market volatility.
The volume in the Bitcoin market has dropped alongside the slow market, reaching the “end of the line,” as one analyst put it:
“Volume trend reaching end of the line. All closes outside local ranges were fakeouts. Watch for this behaviour to break – good odds it’ll signal real direction. Local unconfirmed (skewed) iHS neckline lines up with diag resistance from ATH to now.”
Low volumes and no volatility in confluence, analysts have said, suggest an imminent Bitcoin breakout of macro importance.
Traders have mixed opinions on which way Bitcoin will move after this consolidation. But a Bloomberg analyst recently threw his weight behind the bull case.
Bloomberg Analyst Expects a Bitcoin Breakout to the Upside
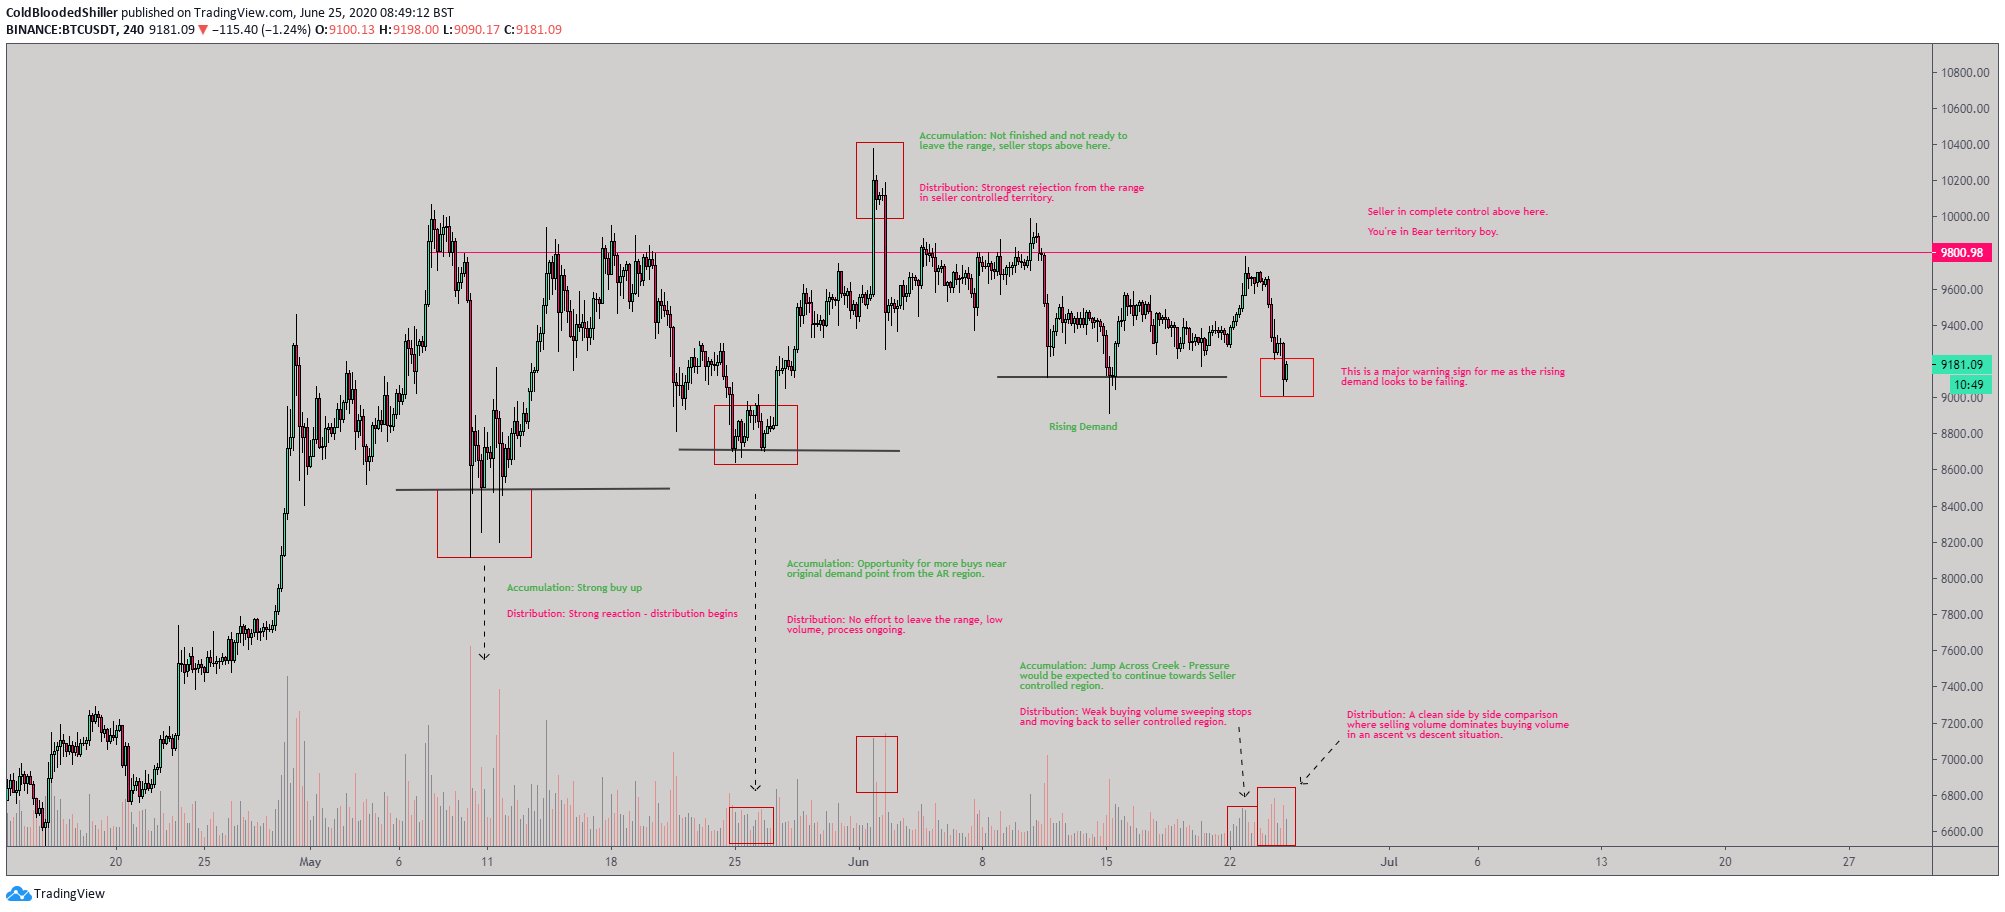
There have been many analysts saying that Bitcoin’s ongoing consolidation will break to the downside. In reference to the chart below, a full-time trader said:
“A couple more clues developing that lend themselves to HTF distribution. 1. Rising Demand on the verge of failing. 2. Side by side, ascent vs descent with selling the dominant pressure from volume.”
He added that should the drop transpire, a correction under $7,000 is entirely possible.

Yet according to Mike McGlone, a senior commodity strategist at Bloomberg Intelligence, the ongoing consolidation is more likely to break higher than lower. The analyst wrote the following on Twitter about Bitcoin’s medium-term outlook:
“Volatility should continue declining as Bitcoin extends its transition to the crypto equivalent of gold from a highly speculative asset, yet we expect recent compression to be resolved via higher prices.”
What’s Behind This Optimism?
McGlone is optimistic about Bitcoin for other reasons.
In reference to the ongoing spike in active BTC addresses, McGlone wrote in a recent Bloomberg report:
“The number of active Bitcoin addresses used, a key signal of the 2018 price decline and 2019 recovery, suggests a value closer to $12,000, based on historical patterns. Reflecting greater adoption, the 30-day average of unique addresses from Coinmetrics has breached last year’s peak.”
The analyst has also mentioned central bank money printing, the CME’s adoption of BTC, and Bitcoin’s ability to outperform altcoins on a macro scale as reasons for the asset to rally.
Featured Image from Shutterstock
Price tags: xbtusd, btcusd, btcusdt
Charts from TradingView.com
Bloomberg: Eerily Low Bitcoin Volatility Will "Resolve Via Higher Prices"


