Bitcoin remains in its tightly coiled range as the market continues its sideways trend for the third week in a row. While macro support has been tested three times recently, we have yet to test the overhanging macro resistance:

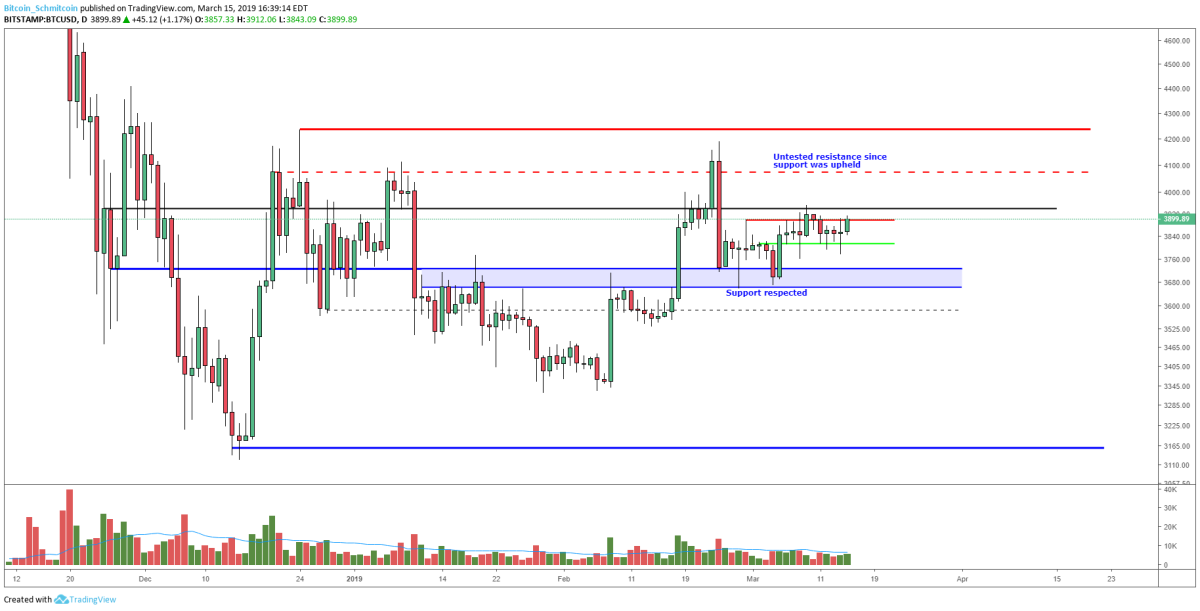
Figure 1: BTC-USD, Daily Candles, Narrow Range
The blue zone outlined above shows a very strong zone of support that, over the last few weeks, has seen three strong tests and has led to a slowly upward-drifting market consolidation. Since re-establishing support, the market has yet to see a meaningful retest of the overhead resistance outlined above in the red dashed and solid lines. The immediate resistance sitting overhead has, historically, been a highly volatile period where supply has manifested and stifled any bullish pressure:

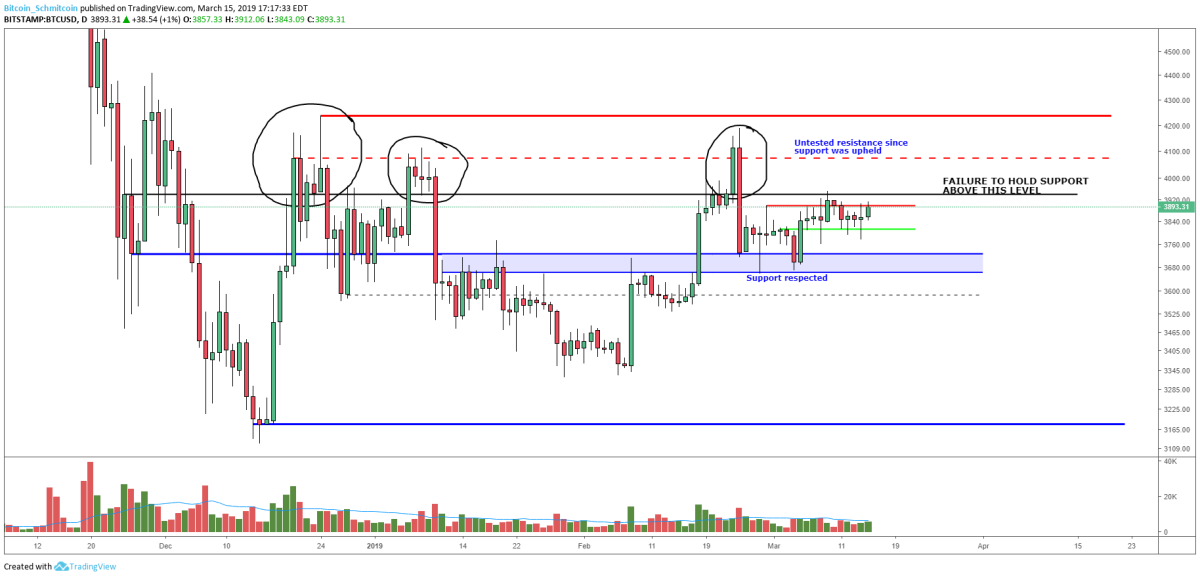
Figure 2: BTC-USD, Daily Candles, Three Rejections
The black level outlined above represents the preliminary level that the market had tested prior to shoving to the red macro resistance levels. In Figure 2, we can see three clear tests followed immediately by three rejections. And now, after finding support on a major, macro level (the blue zone), we seem to be meandering upward into the immediate overhead black resistance.
This current move is considerably different from the prior moves. The three prior tests occurred very violently and were matched with overwhelmingly violent selling responses. Our fourth test, however, has been a slow, persistent grind. Upward drifts like this are often signs of weakening supply and, consequently, a weakening resistance level.
While it is still early to tell and we have yet to actually establish support on this level, the early signs of bearish exhaustion are starting to surface as we make our way upward. If we manage to test and find support on the black level, it seems logical that the next step would be to test the level in the low $4,000s that has been rejected so many times previously.
Because we are stuck in the middle of a range, the market is pseudo-agnostic in terms of its market bias. It’s a bit of a no-man’s-land, so to speak. If we do see a rejection of our overhead level, we can fully expect a retest of the macro, blue support zone shown above. A failure to hold the blue zone would undoubtedly yield a test of our macro lows in the low $3,000s.
We need to see a bullish close either above our current resistance or below our current macro support before any meaningful market movement is realized. Until then, it is just chop-city as we ping-pong back and forth between the upper and lower boundaries of our range.
Summary:
- Bitcoin has continued to consolidate within its narrow range.
- The consolidation has an upward tilt to it that is causing us to slowly grind through a macro resistance level that has seen three strong rejections over the last three months.
- If we fail to break the overhead resistance and find support, we can expect a macro retest of the support level in the mid $3,000s. However, if we break out and find support, we can expect to see, at minimum, a retest of the low $4,000 area.
Trading and investing in digital assets like bitcoin is highly speculative and comes with many risks. This analysis is for informational purposes and should not be considered investment advice. Statements and financial information on Bitcoin Magazine and BTC Inc related sites do not necessarily reflect the opinion of BTC Inc and should not be construed as an endorsement or recommendation to buy, sell or hold. Past performance is not necessarily indicative of future results.


