Since the peak of the 2017 bubble, Bitcoin investors have been wondering when the cryptocurrency will set a fresh high above $20,000. Some thought that it would happen in 2018, but that didn’t transpire. Neither did a new all-time high occur in 2019.
According to a prominent trader, this high will take place in 2021. The caveat: Bitcoin may need to see one more strong move lower before it kicks off an actual macro bull trend.
Bitcoin Could See One More Move Lower Before Bull Run
Over the past two months, Bitcoin’s price action has been effectively confined to a 15% range between $8,600 and $9,900. Save for a few blips, the asset has not deviated from these levels.
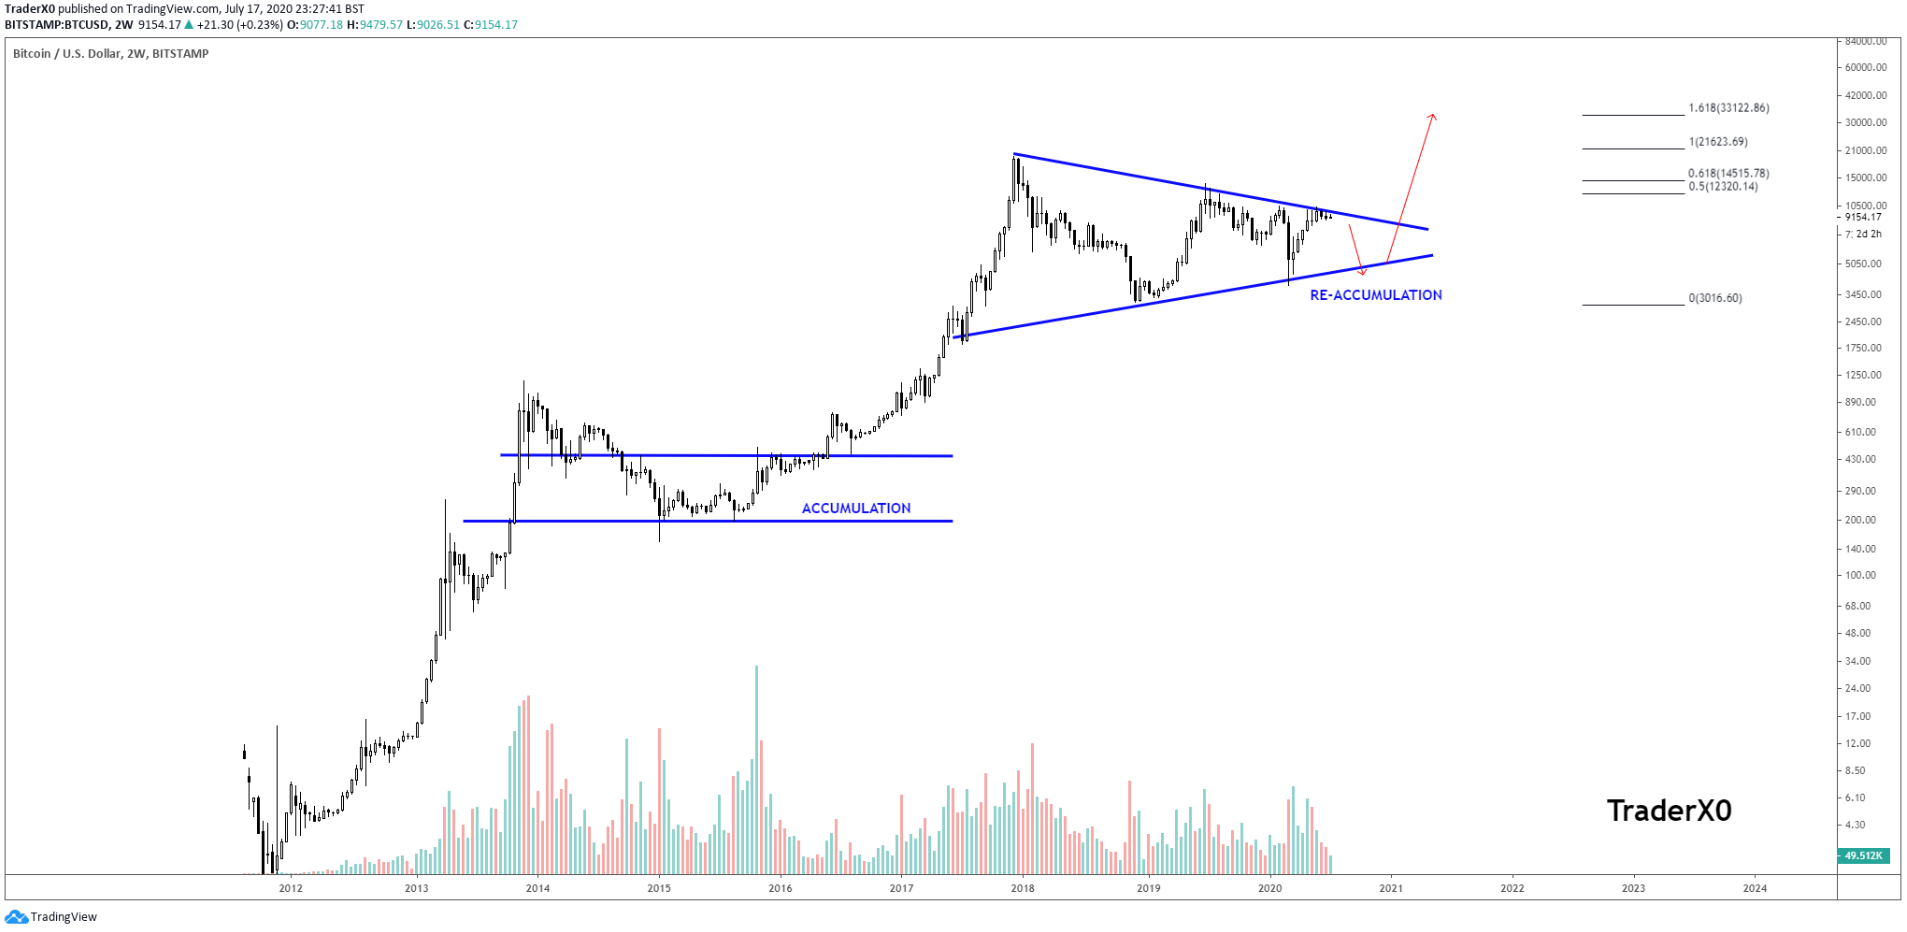
Yet a trader soon expects this consolidation to resolve to the downside. He shared this chart below on July 17th, showing that Bitcoin will likely see “one last set of cycle lows” in and around $4,000 to $5,000 before moving to a new all-time high. That would mark an approximately 40% drop from current levels.
To him, this would satisfy a pennant that has formed on Bitcoin’s macro chart. This same pennant has been observed by other analysts.

The expectation that Bitcoin will soon see a move to the $4,000s-6,000s has been echoed by a swath of other traders.
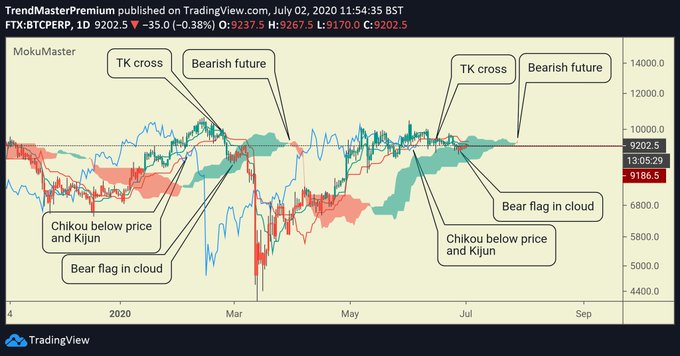
As reported by Bitcoinist previously, one trader that specializes in the Ichimoku Cloud predicted that per the indicator, BTC looks almost identical to how it did prior to March’s drop. As the chart shows, there have recently been four signals printed by the indicator that were all last seen in February/March.

Similarly, institutional traders are building a Bitcoin short via the CME’s BTC futures market. As of recent data, these institutional traders cumulatively hold a net short of around 2,000 contracts.
The last time institutional traders were this ostensibly bearish was before and during the drop in March that took Bitcoin from the $9,000s to $3,700.
Accumulate, Accumulate, Accumulate
Whatever happens, the game for many seems to be accumulation at the moment.
As reported by Bitcoinist previously, Nexo’s Antoni Trenchev said that he thinks Bitcoin is still on track to hit $50,000 in 2020 due to the halving and the money printing by central banks:
“So yes, I’m sticking to my prediction of 50K until the end of the year. I appreciate that it is a bold statement, but the fundamentals are there and the momentum is shifting there as well,” Trenchev concluded to the Bloomberg journalist.
There’s also Lyn Alden, a prominent macro investment strategist. She explained in a blog post that there are three fundamental reasons why she thinks Bitcoin will appreciate far above current prices in the next two years or more.
Featured Image from DepositPhotos
Price tags: xbtusd, btcusd, btcusdt
Charts from TradingView.com
Analyst: Bitcoin Will Pass $20,000 But a 40% Drop Will Happen First


