This may sound like a broken but Bitcoin has once again flatlined in the low-$9,000s. For the past two to three weeks, the leading cryptocurrency has traded within a few percentage points of $9,200 on both sides.
According to an analyst, this consolidation is likely to resolve to the downside as Bitcoin is preparing to fall below a crucial technical level.
Bitcoin Is About to Fall Below A Pivotal Level
Bitcoin’s consolidation over recent weeks isn’t as bullish as many investors have surmised, according to a trader.
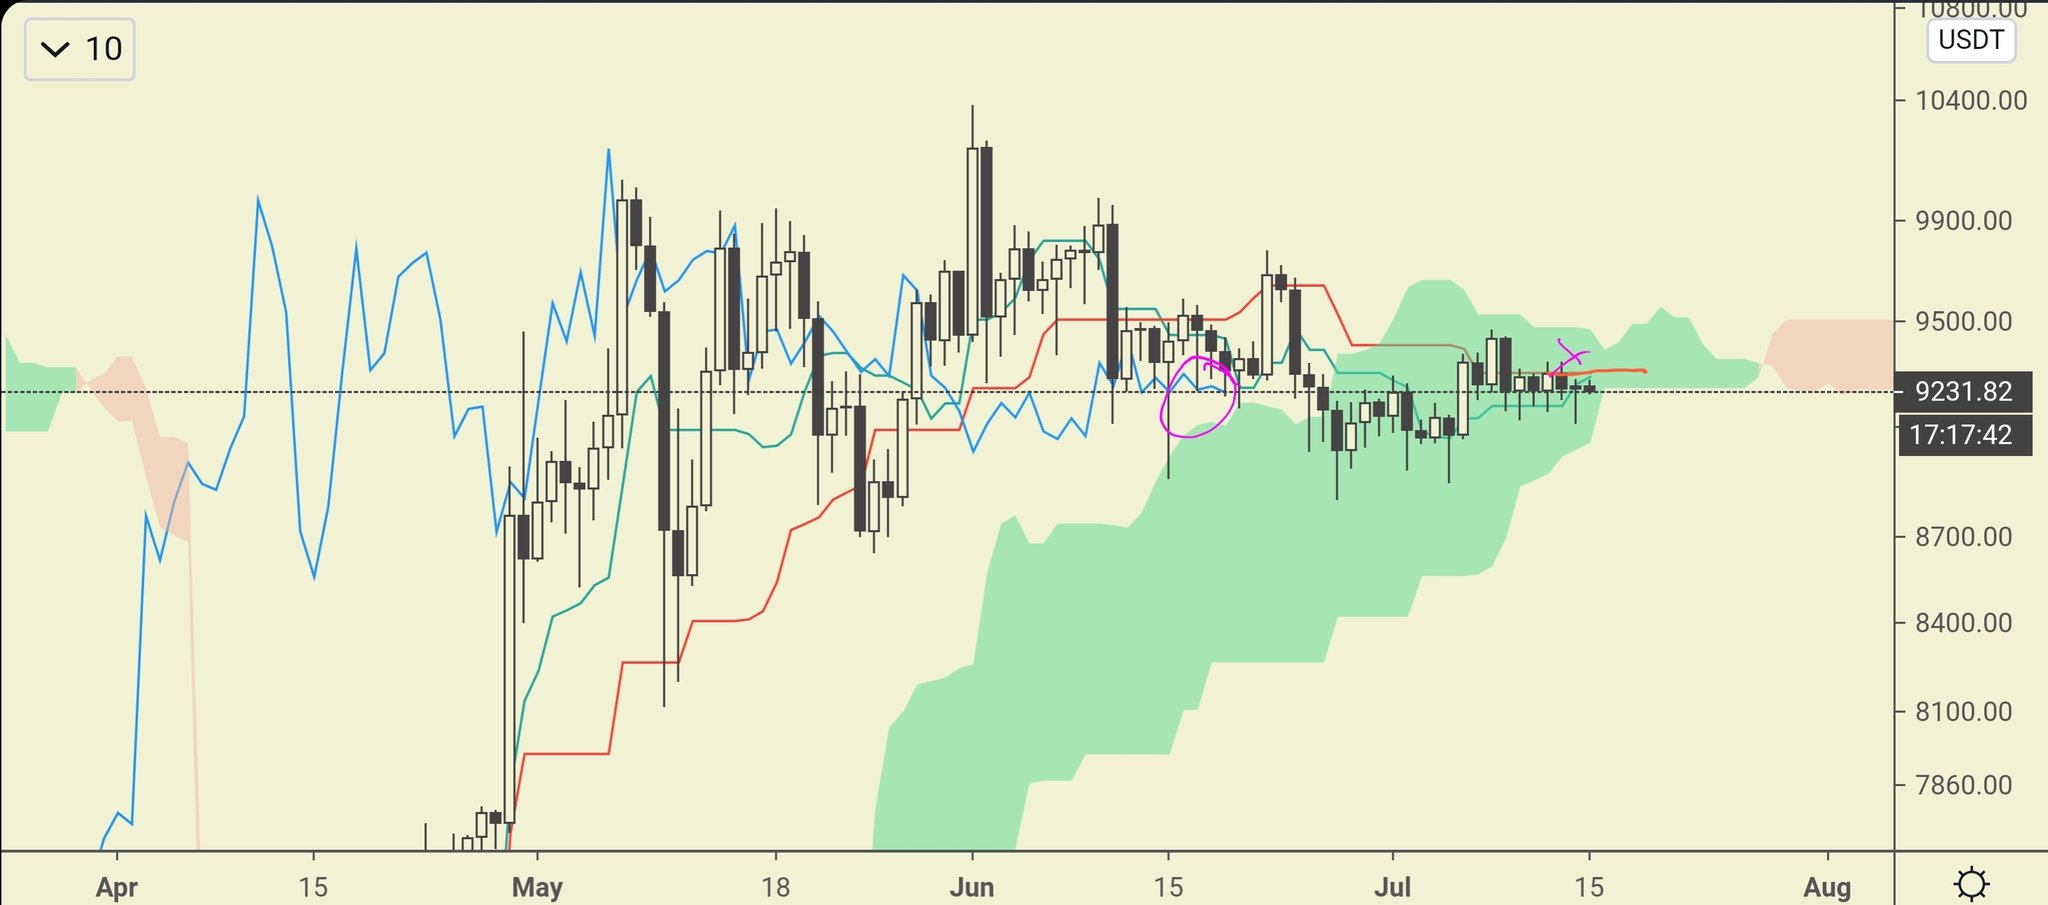
He shared the chart below on July 14th, showing that Bitcoin is about to lose the support of the Ichimoku Cloud, an indicator that shows important levels and trends. As he elaborated:
“If the bearish Moku setup plays out, today/next couple days is quite likely for the breakdown.The more aggressive indicators are struggling to stay bullish and everything else is bearish. Corn teetering here.

Notably, the trader did not share where he expects Bitcoin to fall to should it break down from current levels.
An analysis of Bitcoin that the same trader shared two weeks ago showed a similar trend.
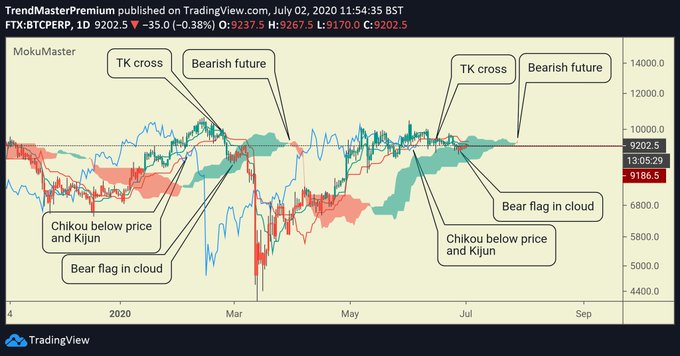
As reported by Bitcoinist previously, he noted that per the Ichimoku Cloud, BTC looks almost identical to how it looked just a few days prior to the crash from the $9,000s to $3,700. Both periods have the four same Ichimoku Cloud signals.

Expansion Is Coming
Not everyone believes that a drawdown is how this consolidation will resolve, but almost all analysts think that Bitcoin will soon break out.
Blockroots’ Josh Rager, a popular crypto trader, noted on July 12th that data from TradingView indicates that Bitcoin’s historical volatility index reading is around 40. As Rager explained, this level is important as every time volatility has been this low, “BTC volatility [was] this low, [there was] major price action between 30% to 60% movement in the following weeks.”
Take the February crash as an example. At the peak of the trend, when volatility was dropping due to Bitcoin’s trend, the historical volatility index read slightly under 40.
Bitcoin historical volatility (HV) nearing 40$BTC volatility this low has historically led to major price action between 30% to 60% movement in the following weeks
From current price:
30% move to the upside is $12,200
30% move to the downside is $6,500Put your seatbelt on pic.twitter.com/ERzWudn547
— Josh Rager
(@Josh_Rager) July 12, 2020
This has been corroborated by Josh Olszewicz, a prominent trader and analyst at Brave New Coin.
He noted that the Bollinger Bands, an indicator that shows important levels and volatility, are at the lowest level since November 2018, prior to the 50% drop from the $6,000s to $3,200.
Featured Image from Shutterstock
Price tags: xbtusd, btcusd, btcusdt
Charts from TradingView.com
Bitcoin Is "Teetering" as Price Prepares to Move Below Crucial Support


