A crypto analyst has made a bullish prediction about Bitcoin (BTC), revealing the ultimate profit target for investors by 2025. The analyst’s report provides an exact figure and a time range for Bitcoin’s next price top. He advises investors and traders to act swiftly and sell their Bitcoin once it reaches this peak, cautioning against an impending bear market.
Here’s When To Sell Bitcoin
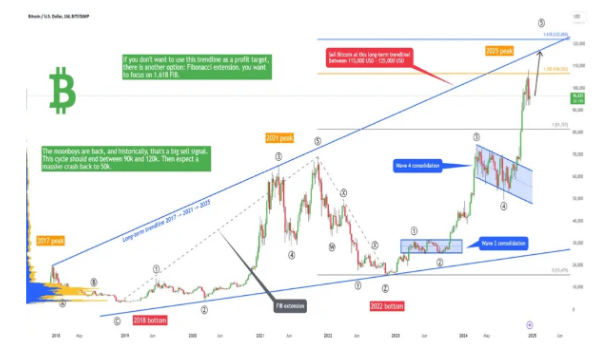
Bitcoin is finally nearing the climax of its long-term bullish cycle, with Xanrox, a crypto analyst on TradingView, projecting a market top and the timeline for the crypto bear market. The analyst has mapped Bitcoin’s future price trajectory using the Elliott Wave Theory and Fibonacci extensions.
Currently trading above the $94,000 mark, Bitcoin is predicted to hit a market peak between $115,000 and $125,000 in 2025. The analyst’s chart identifies a five-wave structure in Bitcoin’s current cycle, with Wave 5 already progressing and expected to reach upper resistance levels.

Based on Xanrox’s chart, Bitcoin’s price movement has closely traded along a long-term ascending trendline from 2017 to 2021. The analyst disclosed that this trendline, acting as a resistance, is set to intersect with Bitcoin’s price in the coming months.
He stressed the importance of this trendline as a sell signal, highlighting that investors should focus on it and set alerts as Bitcoin nears this critical point. The TradingView analyst further declared that once Bitcoin touches the long-term ascending trendline, it is time to sell off and exit the market.
In addition to the trendline, Xanrox mentioned that the 1.618 Fibonacci extension at $122,068 has become a significant static resistance for Bitcoin. While the analyst has projected a price peak between $110,000 and $125,000 for Bitcoin in 2025, he acknowledges that other prominent analysts will likely project higher and almost impossible price targets for the pioneer cryptocurrency.
He explained that predicting Bitcoin’s price to $200,000 or $300,000 by 2025 was unlikely, citing the cryptocurrency’s already massive market capitalization as a deterrent to these ambitious targets. Xanrox indicated that his prediction of Bitcoin’s ultimate profit target is a long-term analysis that will only be confirmed where the confluence of the ascending trendline and the Fibonacci levels occurs.
For his short-term analysis, the analyst predicts that Bitcoin will surge as high as $125,000. However, this significant increase is expected to come after Bitcoin experiences a massive price crash to new lows of around $85,000.
Bitcoin Bear Market Prediction
After Bitcoin reaches Xanrox’s projected market peak between $115,000 and $125,000, the analyst predicts that the leading cryptocurrency will enter a prolonged bear market, marking the end of the bull cycle. According to the Elliott Wave Theory, Wave 4 previously served as a liquidity point and crucial support around the $49,000 mark.
Based on this trend, Xanrox predicted that Bitcoin could retrace to this bearish level, potentially finding support around $50,000 to $60,000 during the bear market. The analyst disclosed that this support level could create an entry point for whales and investors looking to accumulate. He also forecasted that the Bitcoin bear market would likely occur between 2025 and 2026.
Featured image from Pexels, chart from TradingView


