- Bitcoin seriously broke higher on Monday, breaking above $12,400 for the first time since 2019.
- The asset has since suffered a strong correction to $11,900, where it trades as of this article’s writing.
- BTC’s drop comes after the value of gold and the S&P 500 plunged after a strong start to the Tuesday trading session.
- Bitcoin remains above a pivotal support level, though, that analysts say the asset must hold to remain in a bullish state.
- BTC is now trading below the pivotal $12,000 level. That level held as resistance during a number of rallies in the past two weeks.
Bitcoin Must Hold This Level to Maintain Bullish Bias
Across the board, analysts are saying Bitcoin must maintain the $11,700-11,800 zone to maintain the bullish trend it confirmed after the $12,000 breakout.
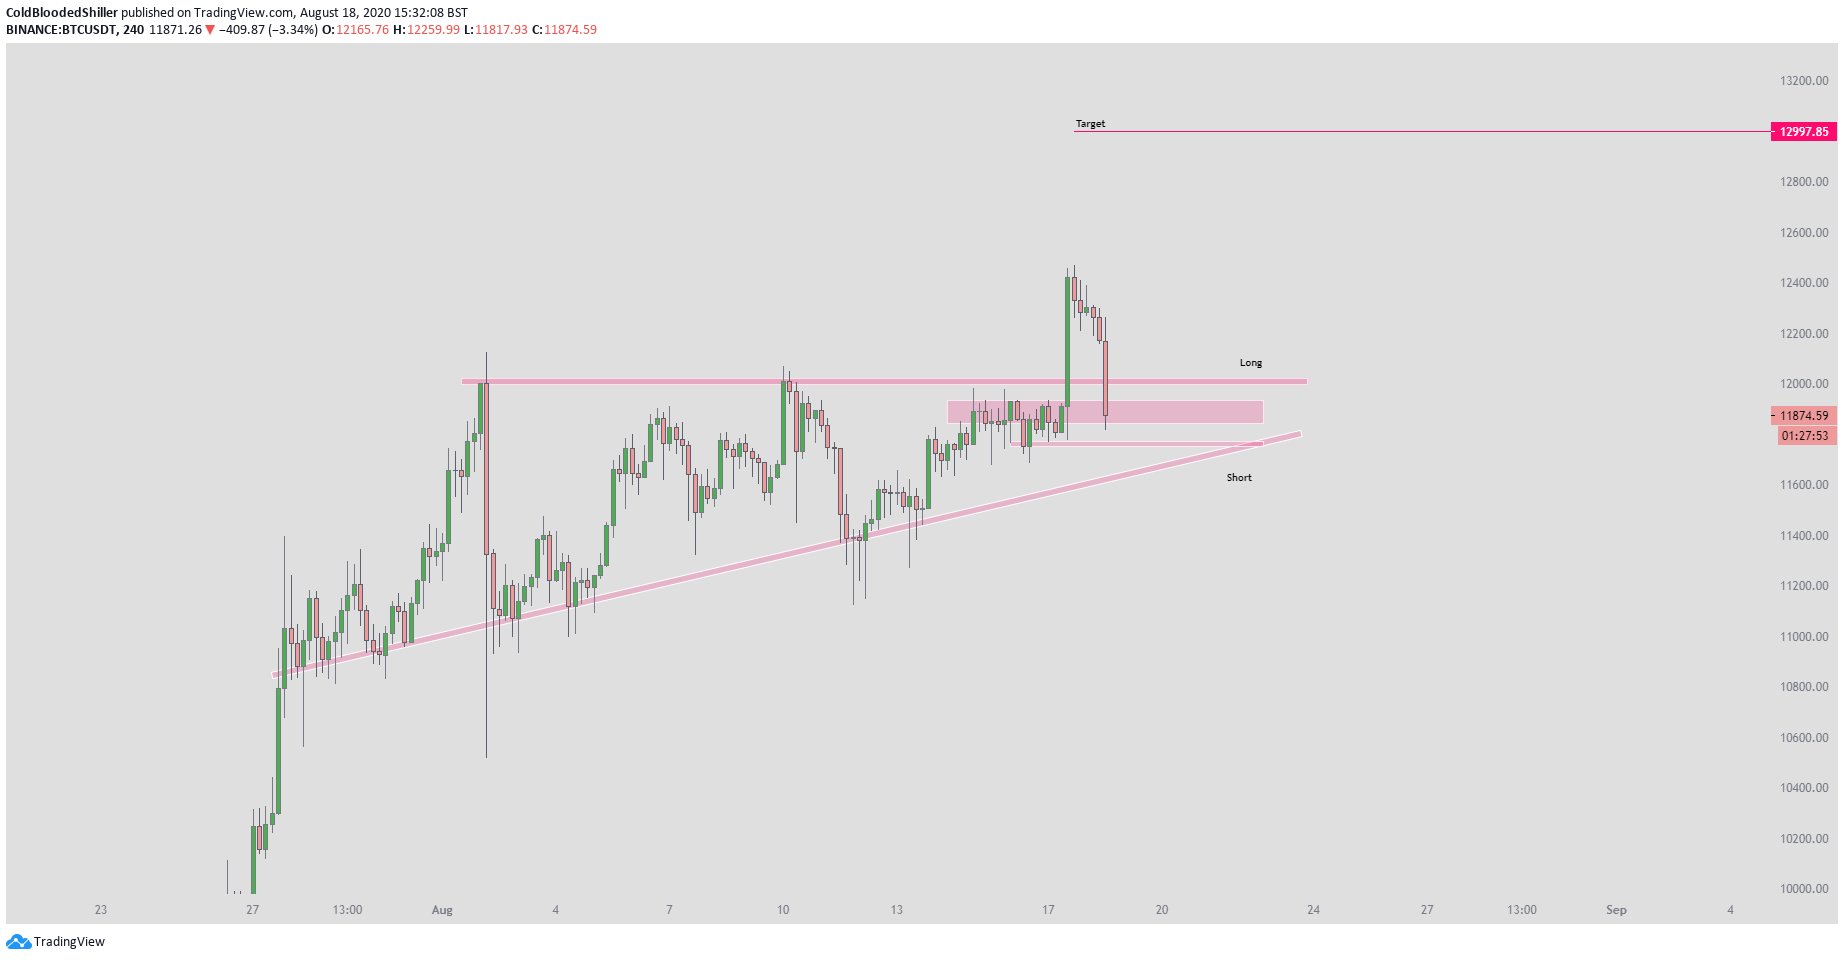
One analyst shared this chart below after the plunge. It shows that $11,700 has been technically important to BTC’s bull case over the past week especially. Bitcoin managing to break below it, towards the bottom of the depicted triangle formation, likely indicates that more consolidation is likely.
“Yikes. Clean reaction no more. Needs that 11700 hold for me. Hour and a half to go,” the trader commented.
Chart of BTC's price action over the past few weeks with analysis by trader "Cold Blooded Shiller" (@Coldbloodshill on Twitter). Chart from TradingView.com
Other analysts have corroborated the sentiment of the importance of the aforementioned region. Referencing the same region that the aforementioned trader mentioned, another commentator explained:
“Bids filled. Won’t stick around long if this continues to drop, but this is the spot I was watching. If we get a bit more bounce I will move my stops up further.”
What’s Next?
What’s next for BTC if it manages to hold the aforementioned support levels?
As optimistic as this may sound, they think that eventually, a move towards $13,000 will be had. $13,000 is the next macro resistance level that Bitcoin faces down after $11,500, some commentators have suggested.
$13,000 is also the target of the ascending triangle Bitcoin has been trading in over the past two weeks. This target is calculated by taking the height of the triangle, $1,000, and extending it upward from the top of the ascending triangle to $13,000.
Some have even gone as far as to say that $14,000 is likely. Another trader who assigned importance to the support around $11,700-11,800 noted that if the asset can hold that level, $14,000 will soon be had.
Chart of BTC's price action over the past few weeks with analysis by "TraderRB" (@Cryptomeowmeow on Twitter). Chart from TradingView.com
Photo by Ingmar on Unsplash
Price tags: xbtusd, btcusd, btcusdt
Charts from TradingView.com
Analysts Are Watching This Level After Bitcoin Price Plunged Under $12,000


