
Bitcoin is trading at a pivotal level following a 10% dip to $60,000, a key psychological support. After a brief sell-off, the price has recovered and is now holding strong, flirting with the potential to rise again and challenge new highs. Investors and analysts are growing optimistic, anticipating a sharp and fast rally in the coming weeks as smart money flows into the market, seizing the opportunity to accumulate BTC.
Key data from CryptoQuant supports this bullish outlook, revealing that demand for Bitcoin from US spot ETFs is on the rise. This surge in institutional interest suggests a positive trend that could drive BTC prices even higher throughout Q4 2024. If the demand continues at this pace, analysts predict an aggressive move to the upside, with Bitcoin potentially pushing toward new all-time highs.
As market conditions evolve, Bitcoin’s current price action will be a critical area to watch, particularly as smart money and institutional demand continue to fuel the narrative of a bullish cycle ahead. Investors are watching closely, with expectations of strong performance in the near future.
Bitcoin ETFs Buying Heavy
Bitcoin is raising concerns among investors who are hoping for a strong crypto bull run to start soon, yet the latest price correction has cast some doubt on the timing. Despite these worries, there is encouraging data to keep investors optimistic.
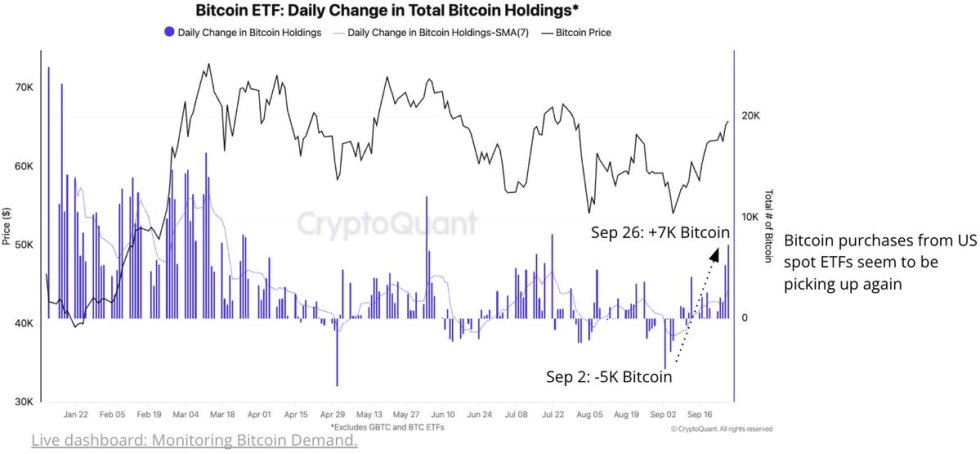
CryptoQuant shared a chart on X showing the daily change in total Bitcoin holdings by ETFs, which points to growing demand. According to the data, spot Bitcoin ETFs went from net selling 5,000 BTC on September 2 to buying 7,000 BTC by the end of the month, marking the highest level of accumulation since July 21.
Historically, these ETF inflows have been a reliable indicator of price momentum. In Q1 2024, spot ETFs were buying nearly 9,000 BTC daily, helping to push BTC to new highs. This renewed demand, if sustained, could be a key driver in pushing prices upward in Q4 2024.
The increasing appetite for Bitcoin from institutional investors adds weight to the argument that a crypto rally is on the horizon. Analysts suggest that as ETF demand grows, it will provide further support for Bitcoin prices, potentially triggering a breakout in the coming weeks. For investors watching closely, these developments could signal that the bull run many are waiting for is just around the corner.
BTC Testing Demand: A Turning Point
Bitcoin is currently trading at $61,838 after successfully breaking above the 4-hour 200 exponential moving average (EMA) at $61,661. This technical move signals potential bullish momentum, though the price is now in a brief consolidation phase as traders assess the next steps. The key focus remains on whether BTC can hold above this 4H 200 EMA level, which is crucial for sustaining upward pressure.

If Bitcoin continues to stay above this indicator, analysts expect a bullish rally to follow, with the next target likely around $66,000. Breaking past this point would reinforce the uptrend and could drive prices higher as market sentiment turns more positive.
However, if BTC fails to close above the 4H 200 EMA, a deeper correction may be on the horizon. In that scenario, traders should watch for a potential drop below $60,000, with a possible retest of lower demand zones around $57,500. These levels could provide key support but would also signal increased volatility and uncertainty in the short term.
Featured image from Dall-E, chart from TradingView