- Bitcoin has undergone a strong rally over recent months from the March lows to $12,500 at the August highs.
- Not everyone is convinced that the crypto’s macro trend is positive, though.
- They point to the fact that Bitcoin has yet to firmly establish itself above $11,500 and $12,000.
- Those two levels have been of technical importance on a macro time frame since the 2017 highs.
- Three crucial reasons, though, suggest that Bitcoin’s macro trend is positive despite the inability to pass the aforementioned resistances.
- There are also underlying bullish on-chain trends that corroborate the expectations of a macro bull trend.
Three Key Reasons Why Bitcoin’s Macro Trend Is Bullish
Bitcoin’s macro trend remains bullish despite its inability to hold above crucial technical levels during the summer rally. One crypto-asset analyst recently shared a series of charts and tweets showing that there are multiple reasons to be bullish on Bitcoin from a macro time frame.
Three of these reasons are as follows:
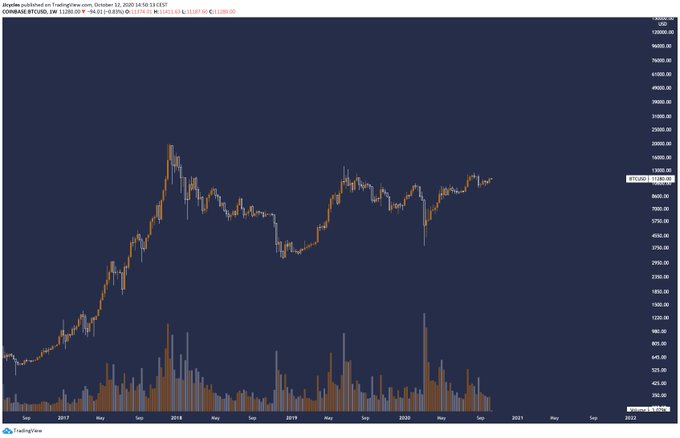
- Bitcoin has flipped the middle of the macro 1,000 range into support, meaning it looks primed to test range highs at $14,000.
- Bitcoin recently broke the multi-year downtrend that originated from the $20,000 all-time high set in December 2017. The downtrend was even retested by Bitcoin in late July, suggesting that it is acting as support. BTC breaking this trendline is important as it acted as resistance in 2019.
- BTC retraced to the “golden pocket” Fibonacci Retracement level in March, suggseting there will be an “impulse wave” towards all-time highs over time.
Chart of BTC's weekly chart since the middle of 2016 with analysis by crypto trader JJCycles (@jjcycles on Twitter).
Chart from TradingView.com
Underlying On-Chain Trends Agree
Underlying on-chain trends agree with the positive sentiment put forth by the aforementioned trader.
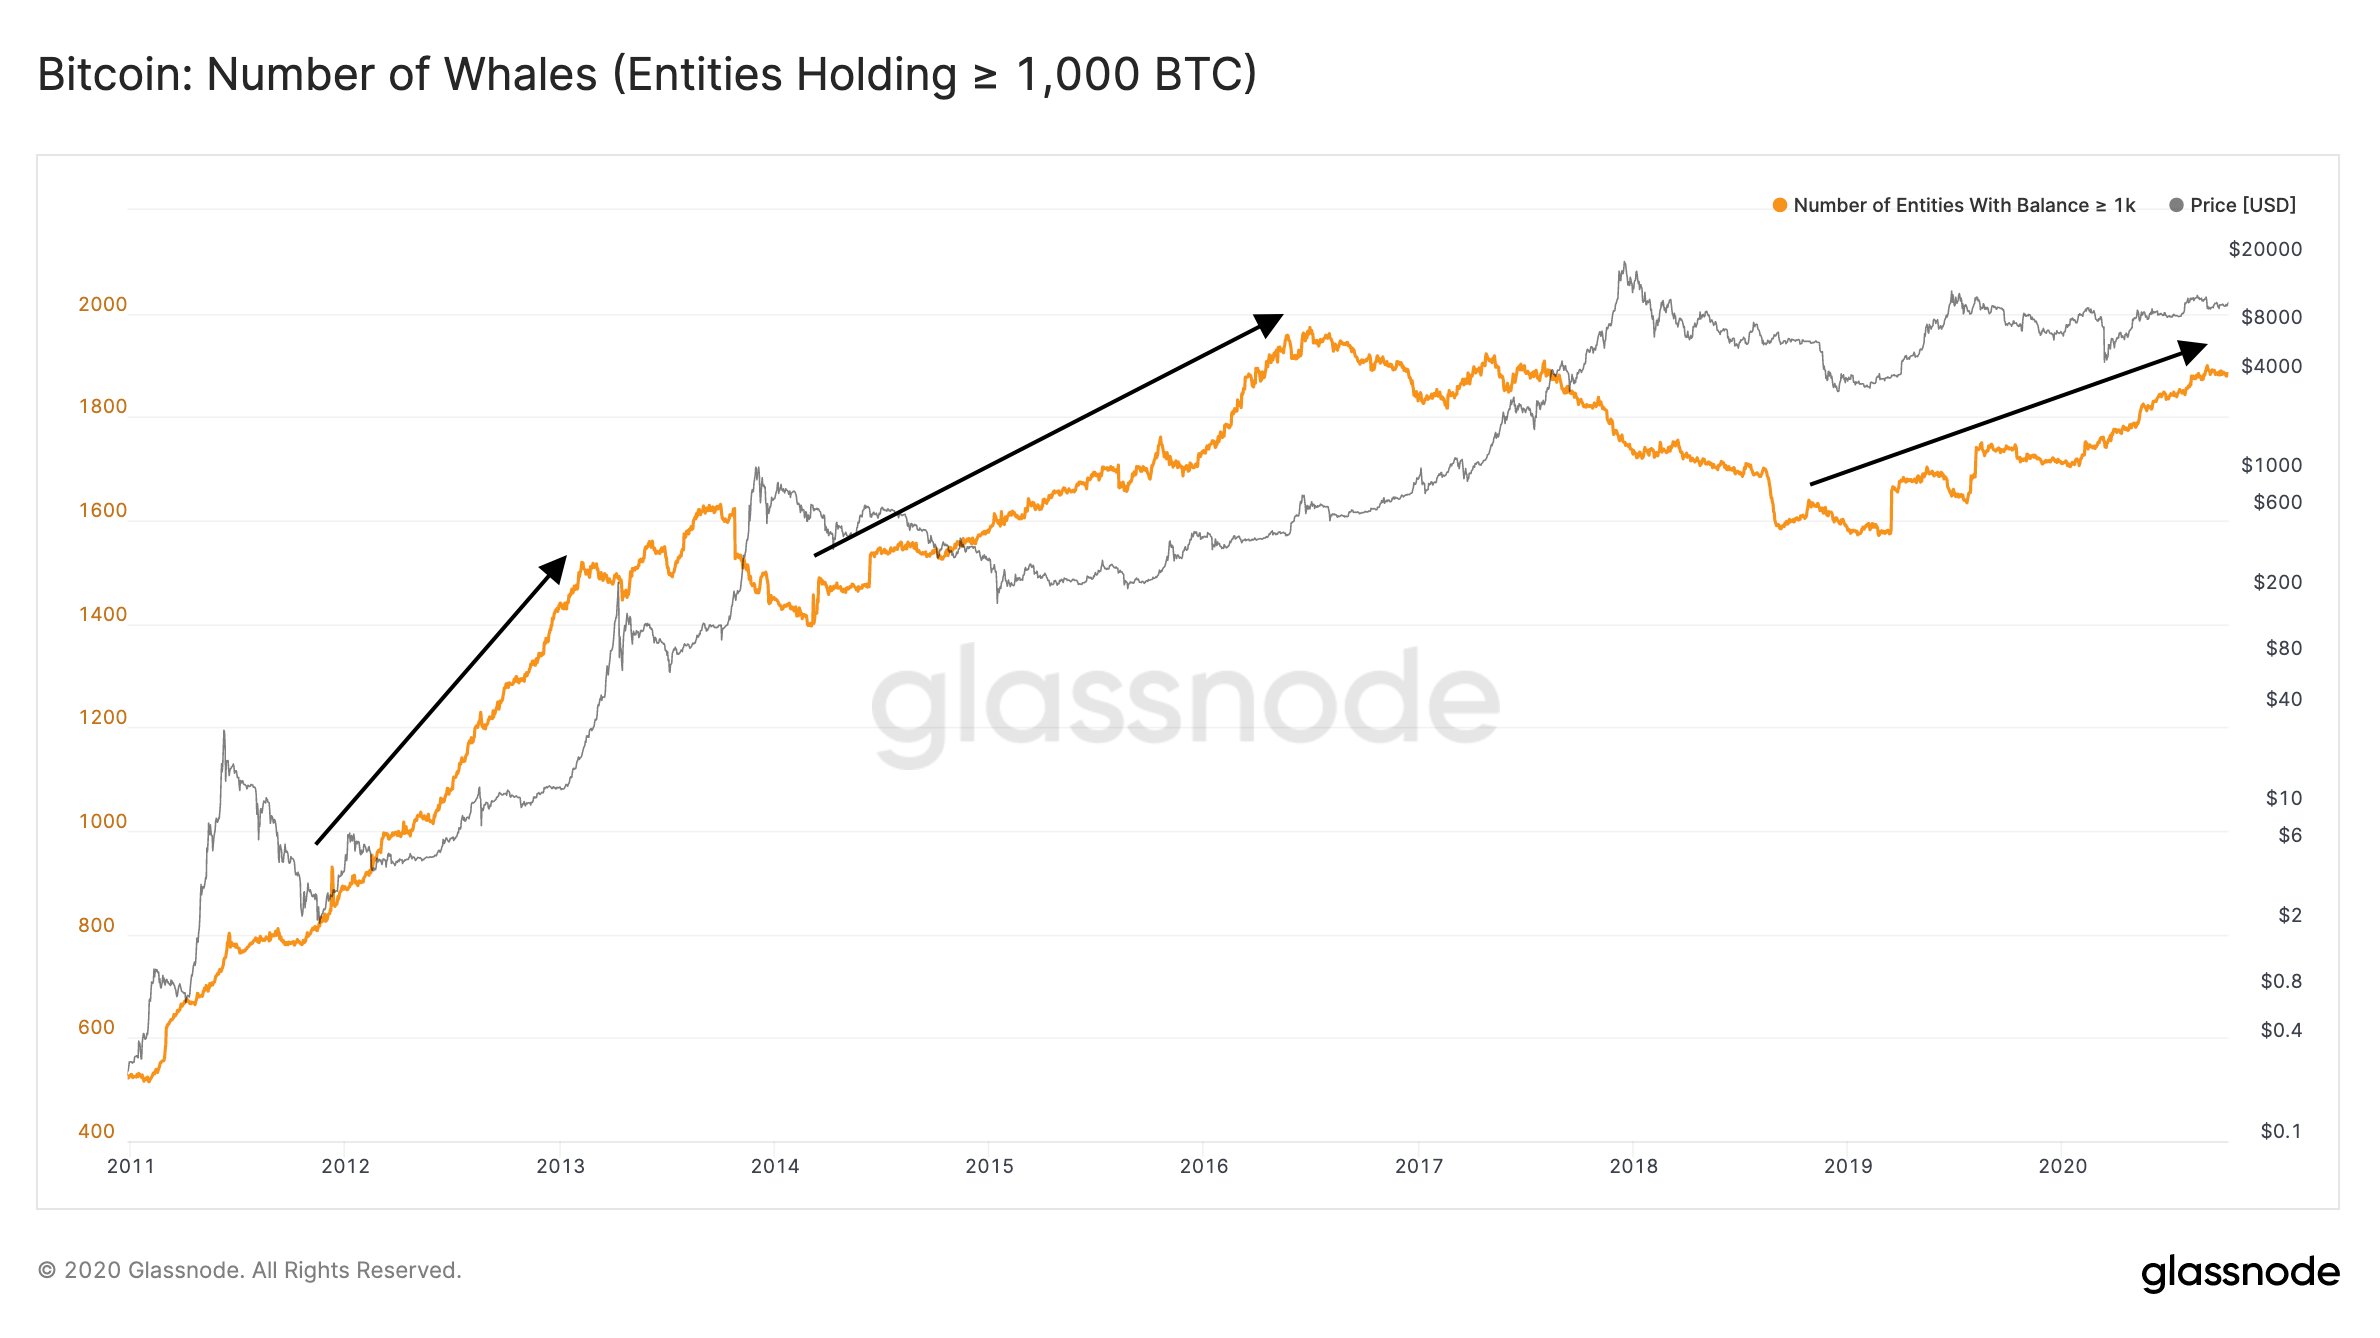
As reported by Bitcoinist previously, Glassnode reported that the number of BTC whales has been on a strong incline since the 2018 lows:
“The number of #Bitcoin whales (entities holding ≥ 1K BTC) has been on an upwards trend for the past months. An indication that more high-net-worth individuals are entering the space to invest in Bitcoin in expectation of $BTC price appreciation.”
Chart of BTC's macro price action with number of whales overlay from Glassnode
Other on-chain trends supporting Bitcoin growth include an increase in the realized cap and a decreasing number of BTC on exchanges, which should support price growth.
Photo by Liza Pooor on Unsplash
Price tags: xbtusd, btcusd, btcusdt
Charts from TradingView.com
Three Key Reasons Why Bitcoin's Macro Chart Is Bullish


