Bitcoin’s sideways trend has left many investors divided over what comes next.
Yet a cryptocurrency analyst who has made historically accurate calls is leaning bearish. Here’s why he thinks so.
Bitcoin Could See a Strong Correction
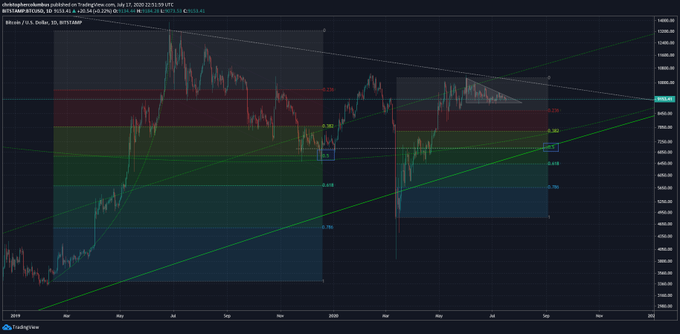
The analyst in question shared the chart below to convey his bearish sentiment.
The chart shows that Bitcoin is currently trading in a descending triangle. A descending triangle is a textbook bear pattern that last had relevance in late-2018, prior to the plunge to the $3,000s.
Should the descending triangle break down, the trader is expecting a drop to the 0.5 Fibonacci Retracement of the rally from the March lows. That coincides with a price of around $6,800-7,200, or approximately 23% lower than the current market price of Bitcoin.
Bitcoin is likely to do this, this analyst suggested, because during the last correction in 2019, the price bottomed at the 0.5 Fibonacci Retracement of the rally.

The analyst noted in a separate chart that Bitcoin’s daily Gaussian channel looks primed to “roll over.” The last time this indicator did so was in March, prior to the drop that took BTC from the $9,000s to $3,700 in dramatic fashion.
Bitcoin is expected to take a similar but not as dramatic dive should the effects of the descending triangle and Gaussian play out as they did in the past.
The same analyst that shared these charts and assertions is the one who in the middle of 2019, predicted that Bitcoin would plunge to $6,400. Not only did the asset bottom at that exact level in December, but he made that prediction when a majority of investors were expecting a move to the “moon.”
Altcoins to Plunge
Along with expecting the cryptocurrency market to undergo a correction after the rally from March lows, the same analyst also expects altcoins to suffer.
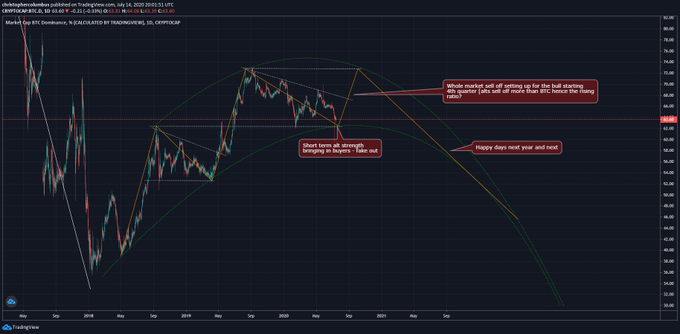
He published this chart around the same time he shared the analysis above. It shows Bitcoin’s dominance metric, the percentage of the cryptocurrency market made up of BTC.
According to his analysis, when Bitcoin sells off, it will outperform the rest of the altcoin market. To him, this means BTC dominance will likely return to the 72-76% region.
That would mark a 30-40% correction in the altcoin market, with losses most likely being centralized in small caps compared to larger altcoins with more purpose.

This analyst is not the only one expecting altcoins to retrace.
Kevin Rose, a general partner at True Ventures, said to TechCrunch in June:
“The problem is that 99% of the projects out there and a lot of the people who are behind them are just in this for the pure financial gain. And there’s a lot of garbage out there. And that’s unfortunate because it really drags down the high-quality projects, and it muddies the space quite a bit.”
This sentiment has been echoed by others in and around the industry, such as Max Keiser and Jason Calacanis.
Featured Image from Shutterstock
Price tags: xbtusd, btcusd, btcusdt
Charts from TradingView.com
This Macro Fractal Predicts Bitcoin Could Soon Drop to the $6,000s


