- Bitcoin has moved much higher over the past two days after many weeks of consolidation.
- Throughout most of September, the cryptocurrency traded snug between $10,000 and $11,000.
- As of this article’s writing, the coin has moved up to $11,050 as it breaks higher on fundamental and technical trends.
- For one, the U.S. dollar is plunging as stimulus talks have seemingly restarted in a manner that should boost alternative assets.
- Analysts think that this may be the breakout that we’ve been waiting for.
- Key technical trends show that Bitcoin’s ongoing price action is of much importance to bulls.
Bitcoin Is Undergoing a Pivotal Breakout, Analysts Say
Bitcoin’s ongoing move higher is one of pivotal importance to bulls, analysts say. In the past 24 hours, the leading cryptocurrency has gained a handful of percent as it pushes past crucial resistances in the high-$10,000s
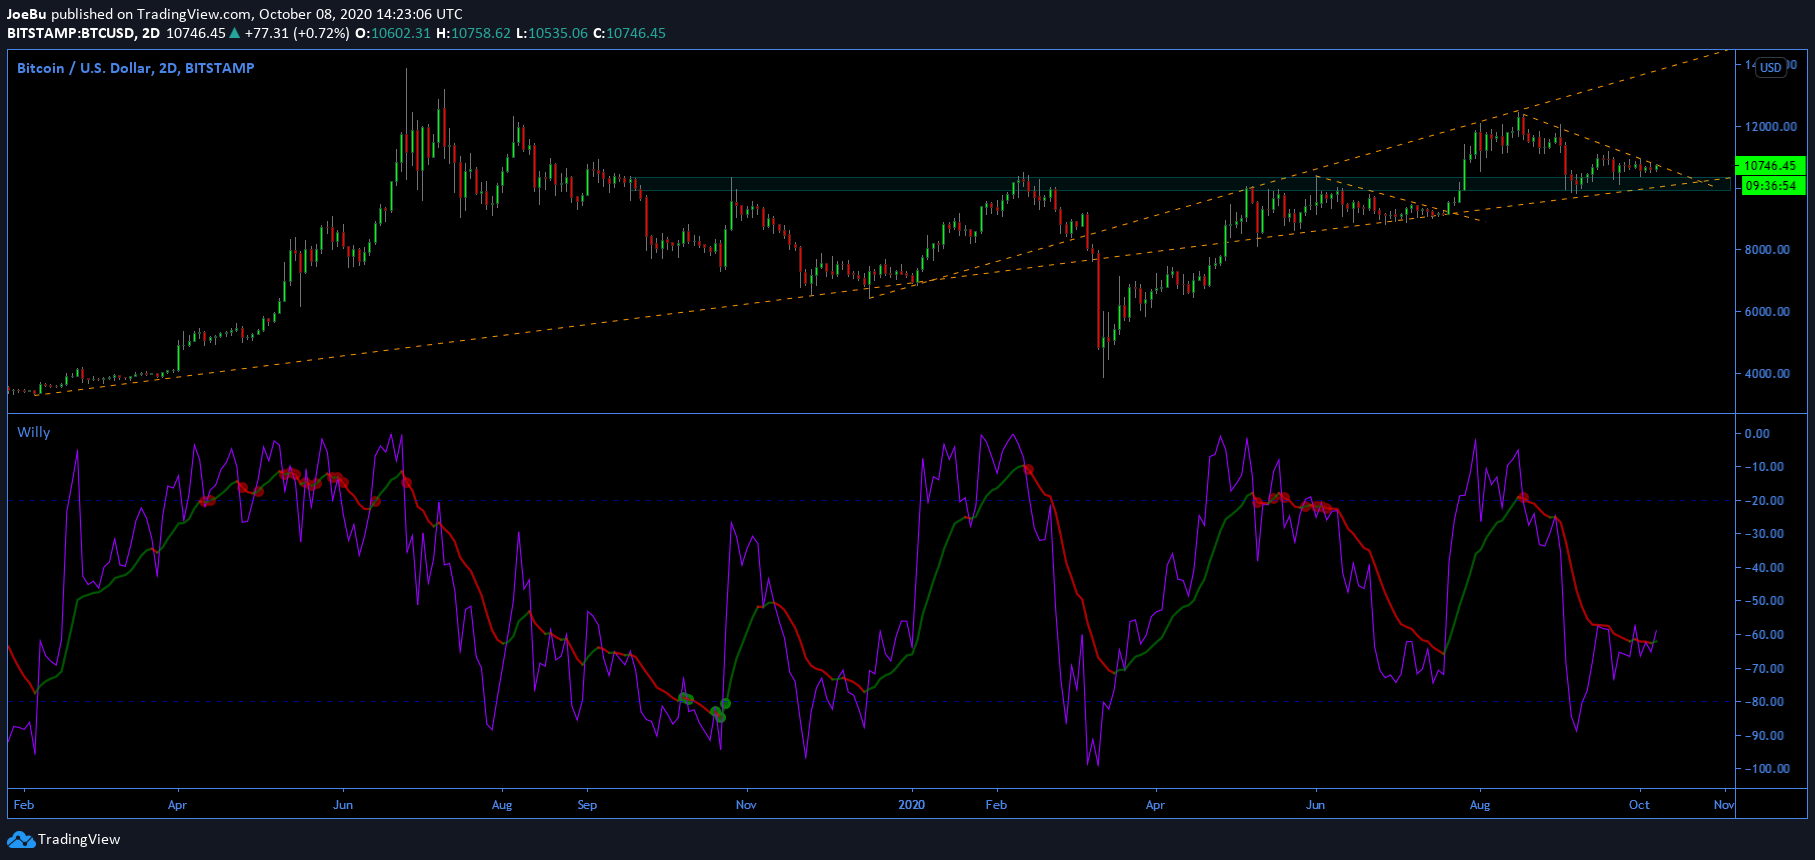
One crypto-asset trader recently shared the chart below: it shows that Bitcoin’s ongoing move to the upside is bringing the coin above a notable downtrend. It is also doing this as the Willy indicator prints a breakout pattern to the upside.
This suggests that the ongoing move higher has strength. The Willy Woo indicator predicted previous bull trends, such as when it printed a buy signal in early April to precede the strong rally to $12,500 in the months that followed. It has also predicted reversals, such as the one that took BTC from $12,000 to $10,000 in late August and early September.
Chart of BTC's price action over the past few years (since start of 2020) with analysis by crypto trader JB (@Blackswan0815 on Twitter).
Chart from TradingView.com
The fundamentals of the space are positive as well.
Vinny Lingham, chief executive of Civic, recently commented on BTC’s prospects in the ongoing macroeconomic environment:
“I haven’t been this bullish on #Bitcoin since 2016. Macro events are teeing us up for another bull run. BTC could go 3-5X in the next 12 months, but if it goes 5X+, we’re back to bubble zone. Key indicator is BTC dominance – if it drops below 35% during the run, caveat emptor.”
That’s to say, should Lingham’s comments come true, the cryptocurrency will rally to $30,000-50,000 in the coming 12 months.
Featured Image from Shutterstock
Price tags: xbtusd, btcusd, btcusdt
Charts from TradingView.com
"This Is It": Bitcoin Is Undergoing a Critical Breakout After Consolidation


