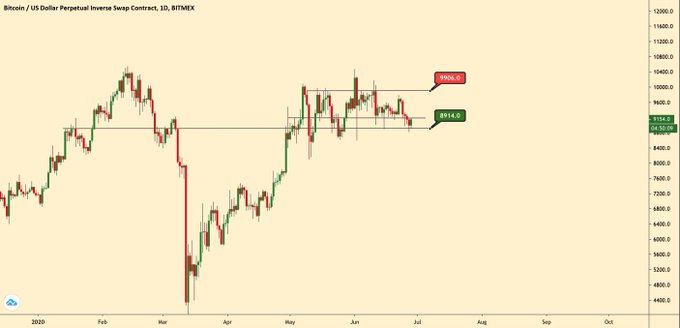
On Saturday, Bitcoin finally broke below $9,000 after a week of consolidation. When the asset slipped under this level, more than $20 million worth of longs on BitMEX were liquidated. This was in addition to the more than $40 million liquidated just two days earlier.
Many were quick to flip bearish as BTC temporarily lost the support of $9,000. One crypto trader shared a chart indicating that a textbook pattern predicting $7,000 was almost confirmed when the drop took place.
Yet an analyst has said that stepping back, Bitcoin is still in consolidation.
Bitcoin Is Still Trapped In a Trading Range
According to the trader that shared the chart below, Bitcoin is still trading in a range, technically speaking.
The analyst noted that since the dump yesterday stopped around $8,900, that support is still in play. “BTC still playing ping pong inside the consolidation range. There is no need to be upset,” he wrote.

Blockroots founder Josh Rager has echoed this sentiment.
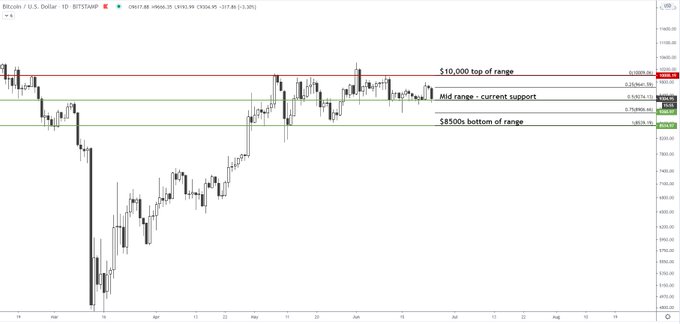
As reported by Bitcoinist previously, Rager said that Bitcoin’s current range is $8,500-10,000. Unless it breaks those levels on a daily/weekly time frame, it remains in that range.
“BTC’s range is clear. Current support that has been holding the past three weeks is the mid-range Break down here and price likely to see $8900 followed by $8500 range bottom,” Rager wrote, referencing the chart seen below.

There’s also a comment from Tone Vays, a former VP at JP Morgan Chase. The Bitcoin analyst said in a recent analysis published to Youtube:
“Like I’ve been saying for months now, I have no reason to walk away from my prediction early in the year that Bitcoin is going to get stuck between $6,000 and $10,000 for the majority of this year,” he said.
Bulls Could Take Control
With BTC still trading in its range, the question of “which way will the consolidation break” has been raised by many.
Right now, many are divided, but there is evidence suggesting bulls will take control.
There is a confluence of fundamentals suggesting the long-term trend is still up. These include but are not limited to: potential macro weakness in the U.S. dollar, a strong gold price, miners pushing Bitcoin’s hash rate higher, and a decrease in selling pressure from HODLers.
There was also a range analysis recently done by a data analyst. It suggests that 77% of the time Bitcoin has looked as it does now (over the past two years), bulls have broken BTC higher.
Featured Image from Shutterstock
Price tags: xbtusd, btcusd, btcusdt
Charts from TradingView.com
No, Bitcoin Breaking Below $9k Was Not a Bearish Breakout:  Analyst


