It’s been an extremely quiet past seven days for the Bitcoin market.
The cryptocurrency has effectively traded within the same 5% range over that time frame, barely deviating away from $9,000-9,400. The chart below from TradingView depicts this trend well as it accentuates how directionless BTC really has been and still is.
Traders know that eventually, the consolidation will break and a trend will form. And the chance that this trend will be a downtrend has seemingly grown as investors have begun to liquidate Bitcoin.
There’s a Sell Wall Slowing Bitcoin From Rallying Higher
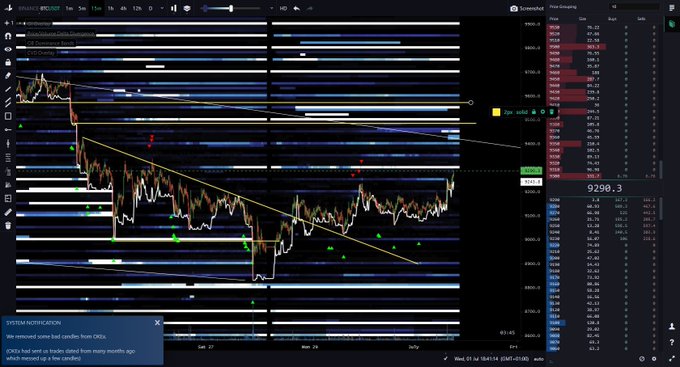
If Bitcoin rallies towards $9,300-9,600, there is a growing likelihood it faces a rejection, order book data shows.
An analyst shared the image below on July 1st, showing that there is a “lot of asks [at] 9300-9600 on Binance’s” order book. There is approximately $15 million worth of sell orders stacked in that region, with most around $9,400.
This strong and broad sell wall adds to the chance Bitcoin will fail to surmount that region. The same analyst shared in a separate analysis that at ~$9,400, there are crucial technical resistances. These include but are not limited to, a key simple moving average, a textbook “pivot” price, and the 61,8% Fibonacci Retracement of the $10,500 highs.

The existence of a multi-million-dollar sell wall on Binance’s order book suggests Bitcoin investors on the exchange expect downside. This is seemingly the case on other exchanges, according to other data Bitcoinist has compiled.
According to the same tool depicted in the chart above, there is an abnormal amount of sell orders around $9,300 on BitMEX’s order book. And on Coinbase, there seems to be some resistance at $9,600.
A similar bearish sentiment can be observed when looking at the public data pertaining to the CME’s Bitcoin futures market.
More HODLers Than Ever Before
While there may be many sellers of Bitcoin at the moment, the number of long-term holders is at an all-time high.
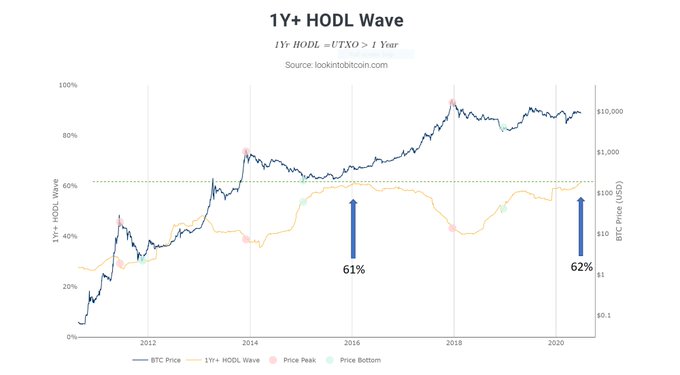
As reported by Bitcoinist previously, on-chain analyst Philip Swift recently observed that 62% of all BTC has not moved in a year or more:
“Bitcoin 1yr HODL new ATH!! We have reached a new all-time high, with 62% of bitcoin not moving on-chain for at least 1 year. Strong hands from hodl’ers! Such high levels of HODL’ing have been present at the start of previous Bitcoin bull runs.”

Simultaneously, the number of addresses holder one BTC or more has hit a new all-time high in excess of 820,000.
These metrics seemingly confirm that while there is short-term sell pressure, the bulk of Bitcoin investors still expect upside in the long run.
Featured Image from Shutterstock
Price tags: xbtusd, btcusd, btcusdt
Charts from TradingView.com
There's a Harrowing Multi-Million Dollar Bitcoin Sell Wall at $9,400


