- Bitcoin and Ethereum have both embarked on strong rallies in the past four months.
- In the past month alone, ETH has gained approximately 80% while BTC has gained approximately 30%.
- Both assets are some of the best-performing markets in 2020, which comes in spite of the pandemic.
- An analysis by a Coin Metrics data scientist, though, may suggest that Bitcoin and Ethereum are reaching local highs.
- The analysis found that a metric or a ratio is reaching highs not seen since the February high, prior to the March capitulation crash.
Ethereum Could Be Reaching a Medium-Term High—and Bitcoin Might Be Too
Ethereum’s price action over the past few months has undoubtedly been impressive. Shaking off the crash in March, the asset has gained 80% in the past month alone as the network’s fundamentals have seemingly become bullish.
An analysis by Jon Geenty of Coin Metrics, a blockchain analytics and data firm, though, may suggest that a high is near.
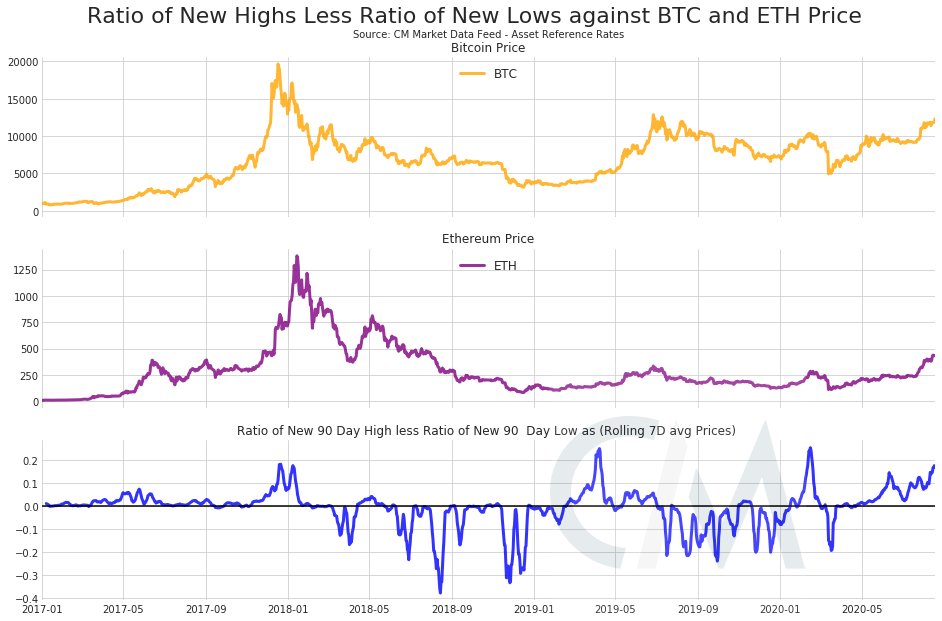
He shared the image below on August 18th. It shows Bitcoin’s macro price action, Ethereum’s price action, and a specific ratio of prices.
According to the ratio, the crypto market is nearing an “inflection point.” Last time this ratio was this high, the crypto market topped in February. The time before that, the price of Bitcoin and Ethereum consolidated for a number of weeks before heading higher. And the time before that was when Bitcoin and Ethereum reached peaks in the 2017-2018 crypto bubble.
“We are entering an interesting period for an indicator looking at new highs less new lows as a percentage of total assets – seeing levels seen only at major inflection points in the past… [This is] still significant as in the past this has signaled both large bullish and bearish moves.”
Chart of BTC's macro price action, ETH's price action, and a specific market ratio calculated by Coin Metrics analyst Jon Geenty.
Should history rhyme, ETH and BTC may soon plunge from their highs, potentially after pushing a bit higher.
Fundamentals Still Favoring Bulls
The fundamentals of the Bitcoin, Ethereum, and crypto markets, though, are still favoring bulls.
On Bitcoin, in particular, analysts have identified a staggering confluence of reasons to be optimistic about BTC’s prospects. Prominent Bitcoin proponent “Vortex” recently shared four of these reasons:
- Adoption of SegWit has reached an all-time high.
- The hash rate of the Bitcoin network has reached an all-time high.
- The percentage of BTC in circulation that hasn’t moved in over a year has reached an all-time high.
- Google Trends for “Bitcoin” and related keywords are starting to trend higher.
Of course, these aren’t directly reasons to be bullish on Ethereum. But as is the norm, ETH follows the price action of the market leader on a macro basis.
Featured Image from Shutterstock
Price tags: ethusd, ethbtc
Charts from TradingView.com
Last Time This Metric Was This High, Ethereum Reached Its February High


