After a rally from $3,700 to $10,000 in a matter of months, Bitcoin’s upward trend has paused over recent weeks.
BTC’s inability to continue to surge higher has left some expecting downside.
Prominent gold proponent Peter Schiff recently wrote on Twitter that he expects Bitcoin to break the $9,000 support. Schiff added that he still thinks the cryptocurrency is embroiled in a bear market. Others have argued that Bitcoin failing to surmount the $10,000 resistance is a death knell for bulls.
On-chain data, however, tells a bullish story.
On-Chain Data Shows Bitcoin Is in a Macro “Buy” Zone
Bitcoin is in a macro accumulation phase, according to the chief executive of the crypto data platform CryptoQuant (CQ).
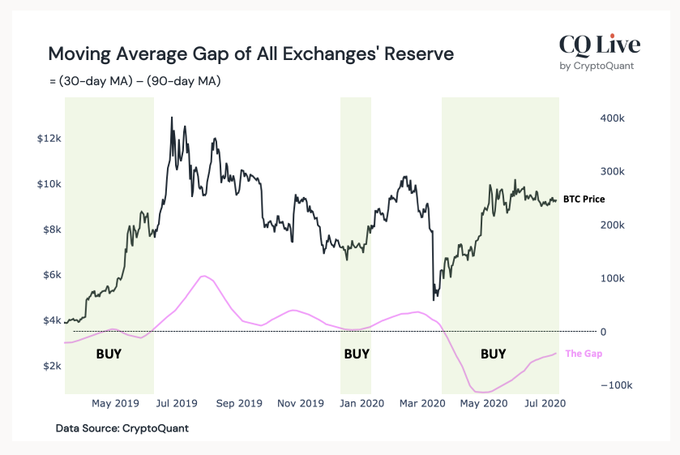
Ki Young Ju shared the chart below on July 13th. It shows that one of his company’s indicators suggests that because Bitcoin is in accumulation.
“We are in the #BTC accumulation phase. The 30- and 90-day moving average gap of all exchanges’ reserve represents the downside risk. It hit a record low in May this year and is still below zero.”

This is important for the bull case, according to the industry executive.
He explained that since 2015, whenever this indicator has signaled accumulation/buy (touched zero or fell into the negative), Bitcoin performed well in the months afterward.
Prior to BTC rallying from $1,000 to $20,000, the indicator fell into the negative. And marking the bottom of the 2015 bear market was also a period of accumulation.
“Looking at the history of Bitcoin since 2015, we can see that whenever it touches zero or going negative, the downside Risk decreases, meaning the accumulation phase,” Ki Young Ju explained.
Corroborated By Other On-Chain Signs
CryptoQuant’s exchange reserves indicator is far from the only on-chain signal suggesting BTC is entering into a period of bullish price action.
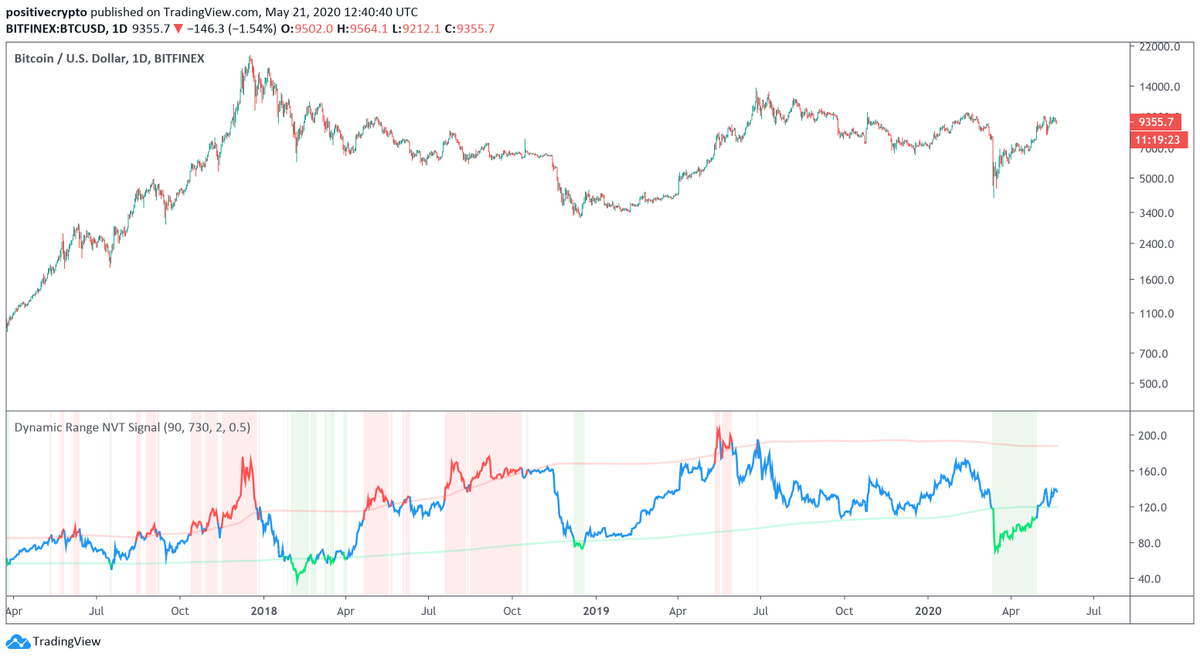
As reported by Bitcoinist previously, on-chain analyst Philip Swift noted that the Dynamic Range NVT Signal entered a bullish phase in May. The indicator has been dubbed a “price to earnings ratio for Bitcoin.”
“Dynamic Range NVTS has been closing up above the lower green band. This is high time frame bullish. Previous NVT Signal lost its efficacy over time. This version with dynamic bands is much more useful as an oversold/overbought tool for strategic investing,” Swift wrote.

Weeks later, the same analyst noted that the percentage of all Bitcoin in circulation that hasn’t moved in a year passed 62%. This is a new all-time high, which by historical standards suggests a bull run is near.
Featured Image from Shutterstock
Price tags: xbtusd, btcusd, btcusdt
Charts from TradingView.com
Last Time This On-Chain Signal Appeared, Bitcoin Rallied 30% in 2 Months


