Bitcoin has undergone yet another rally over the past 24 hours, rallying from yesterday’s lows near $13,300 to highs of $14,250. The coin currently trades for $14,100. A key technical indicator, though, indicates that the cryptocurrency may consolidate as the price action cools down.
Bitcoin Primed to Consolidate, Or Even Drop: Key Analysis Shows
The chart below was shared by an analyst amid Bitcoin’s latest leg higher. It shows BTC’s price action has recently printed an “Extended 13” candle, which was last seen prior to consolidation in May, June and July. This candle was also seen at the December 2019 lows and the June 2019 highs, suggesting that a reversal is likely.
Chart of BTC's price action since the end of 2017 (CME) with analysis by crypto trader Threshold (@Threshandle on Twitter).
Source; BTCUSD from TradingView.com
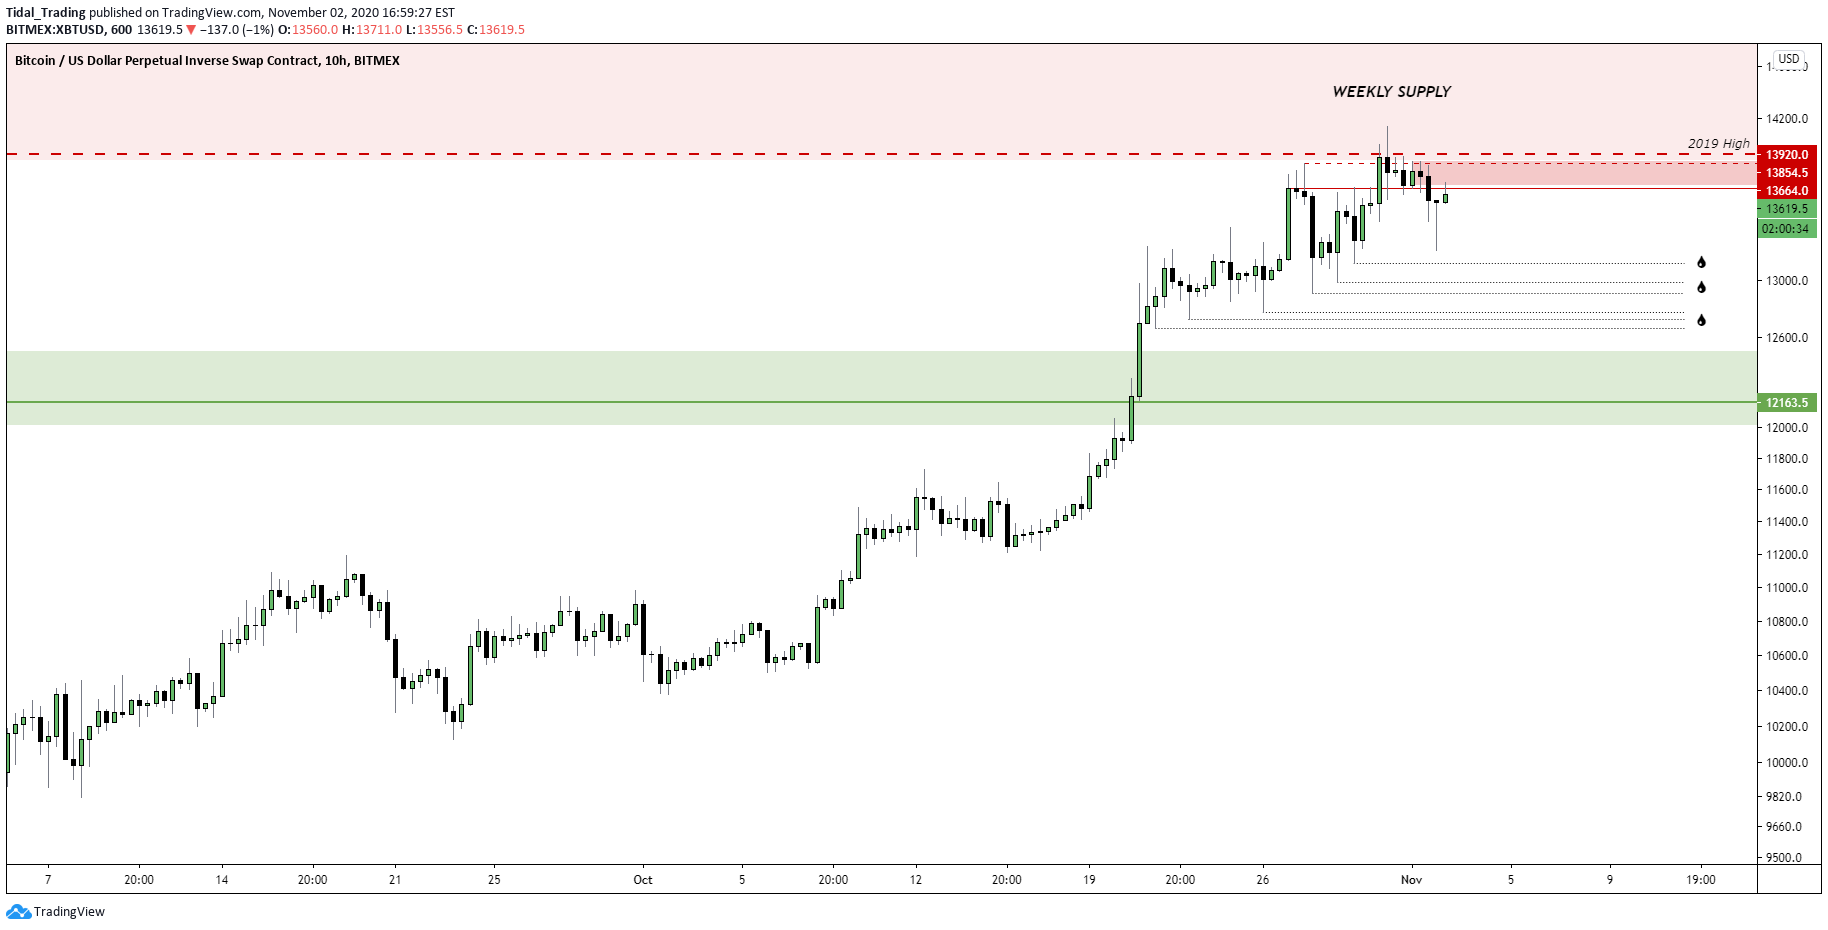
Other traders are also calling for Bitcoin to consolidate from here. One trader said that with the cryptocurrency failing to hold above the $14,000 weekly supply zone, it will likely reload with a dip toward $13,000, then potentially slightly lower if the market fails to catch a bid. He elaborated, referencing the chart seen below:
“$BTC looks like it needs to reload. Daily SFP into weekly supply, failed break above 2019 high, bear divs flashing on the daily time frame… Bring on the election dip.”
Chart of BTC's price action since the start of September with an analysis by crypto trader HornHairs (@Cryptohornhairs on Twitter).
Source: BTCUSD from TradingView.com
Another commentator said that with potential uncertainty regarding the election, Bitcoin could actually be short from here. He also pointed out that with BTC failing to hold $14,000 on a daily or weekly basis, a drop may follow suit.
“Short again on $BTC, something about this weekend pump seems fishy. 3 drives-ish into major resistance, stocks shit the bed last week, election early next week, solid RR and $DXY on support. Still bullish overall, pull backs aren’t a bad thing. Let’s see what happens.”
Election Certainty to Drive Bullish Price Action
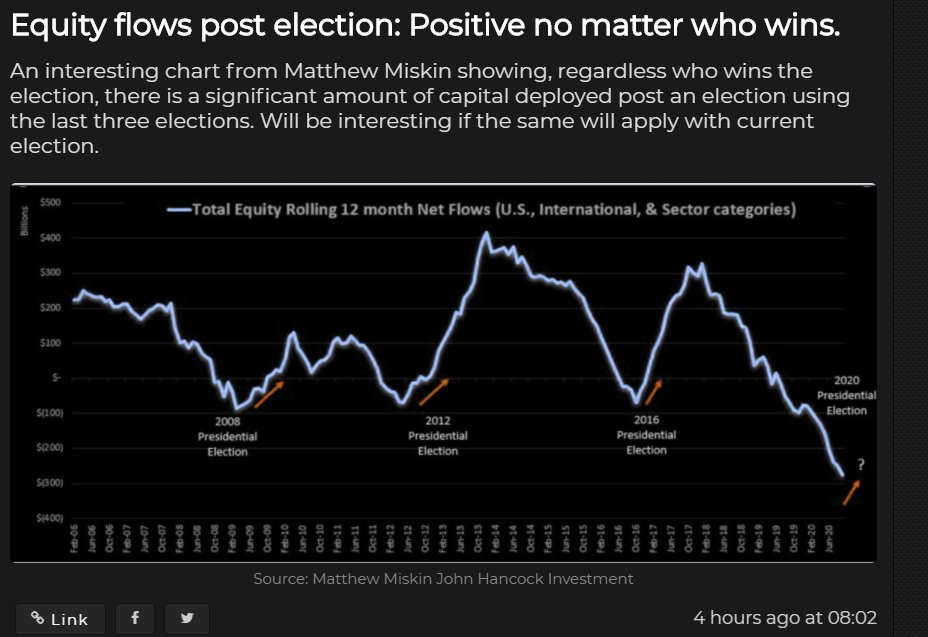
Analysts think that the stock market and other markets may boom once a president-elect is decided decisively, with no contention from the other candidate. Light, a prominent Bitcoin analyst, shared the chart and note seen below on the day of the election, writing “Post-election empirically has seen risk-on flows.”
As the chart shows, the amount of capital that has entered the equity market after the prior elections was large. Should this happen again, the price of Bitcoin and other top cryptocurrencies could rocket as the market benefits from buyers.
https://twitter.com/lightcrypto/status/1323838316559491073/photo/1
Featured Image from Shutterstock
Price tags: xbtusd, btcusd, btcusdt
Charts from TradingView.com
Key Indicator Shows Bitcoin Is Likely to Consolidate Despite $14k Break


