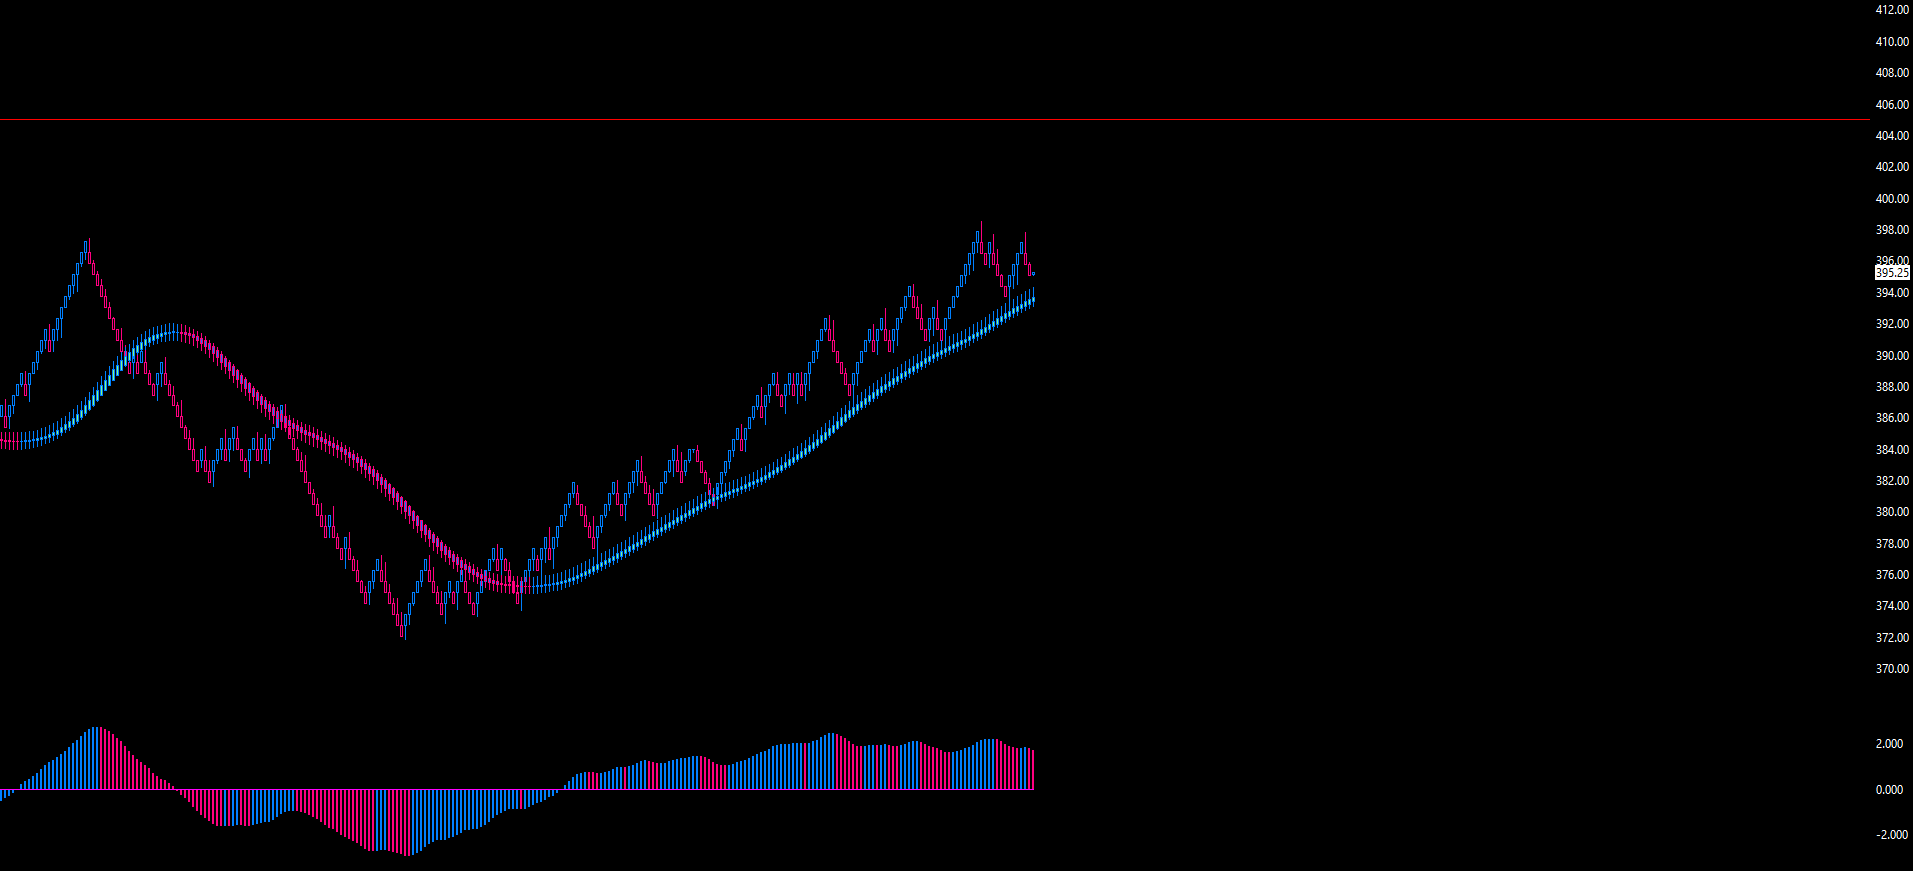
- Ethereum has seen a strong macro rally over the past two months, rallying from $240 to $420 as of this article’s writing.
- ETH traded higher, as high as $440 just two weeks ago.
- The Tom Demark Sequential predicts that ETH’s rally will pause for a number of weeks, and maybe reverse lower.
- This assertion comes courtesy of a historically accurate signal for Ethereum.
- Bitcoin’s price action may end up determining ETH’s, though.
Ethereum’s Price Rally Will Pause in the Near Future
According to a Telegram channel tracking appearance of the Tom Demark Sequential “9” candle, Ethereum is bearish.
The Telegram channel shared this chart below on the morning of August 31st. It shows that ETH has formed a “sell 9” candle against the dollar on its weekly chart. Such “9” candles are seen prior to bearish inflection points in the trend of an asset.
The Tom Demark Sequential has had eerie accuracy in predicting Ethereum price action over recent years. As the chart below shows, there was a “sell 9” candle at the May highs, prior to a four-week retracement, and there was a “buy 13” at the March capitulation lows.
There are also three other instances shown in the chart below where ETH has come in handy.

Chart of ETH's price action over the past few years with the Tom Demark Sequential from a Telegram channel tracking the indicator.
Chart from TradingView.com
The appearance of this bearish signal comes as crypto analysts have flipped bullish on ETH after it managed to print a reversal candle just this past week.
As reported by Bitcoinist, one certain trader targeted $405 as the point that they would turn from bearish to bullish on Ethereum. The coin now trades for $420.
“If you ask “why?” $405 represents the cleanest set up with the best stopping point for me to believe that the correction is over and the uptrend resumes. It’s simply the line in the sand for my set ups, below, short favoured, above, we resume upside movement. Good movement on $ETH right up into $405. Somewhere around here is the major decision point for me,” the trader said on the importance of price action around $405.
Chart of ETH's price action over the past few weeks with analysis by crypto trader Cold Blooded Shiller (@Coldbloodshill on Twitter). Chart from TradingView.com
Dictated by Bitcoin’s Price Action
What may end up pushing Ethereum higher from this consolidation is price action in Bitcoin. The leading cryptocurrency, after all, dictates the directionality of the rest of the cryptocurrency market.
Analysts are currently expecting BTC to soon break higher as the fundamentals of the asset continue to strengthen. For instance, investing giant Fidelity Investments revealed last week that it has its own Bitcoin fund.
Featured Image from Shutterstock
Price tags: ethusd, ethbtc
Charts from TradingView.com
This Historically Accurate Signal Predicts Ethereum's Rally Will Pause


