- Earlier this month, Bitcoin was rejected at the pivotal $12,000 resistance level after recovering from a drop to $11,000.
- The cryptocurrency proceeded to drop as low as $9,800, with the market selling the failed breakout attempt.
- Bitcoin now trades at $10,800, far below those recent highs and below some technically important levels.
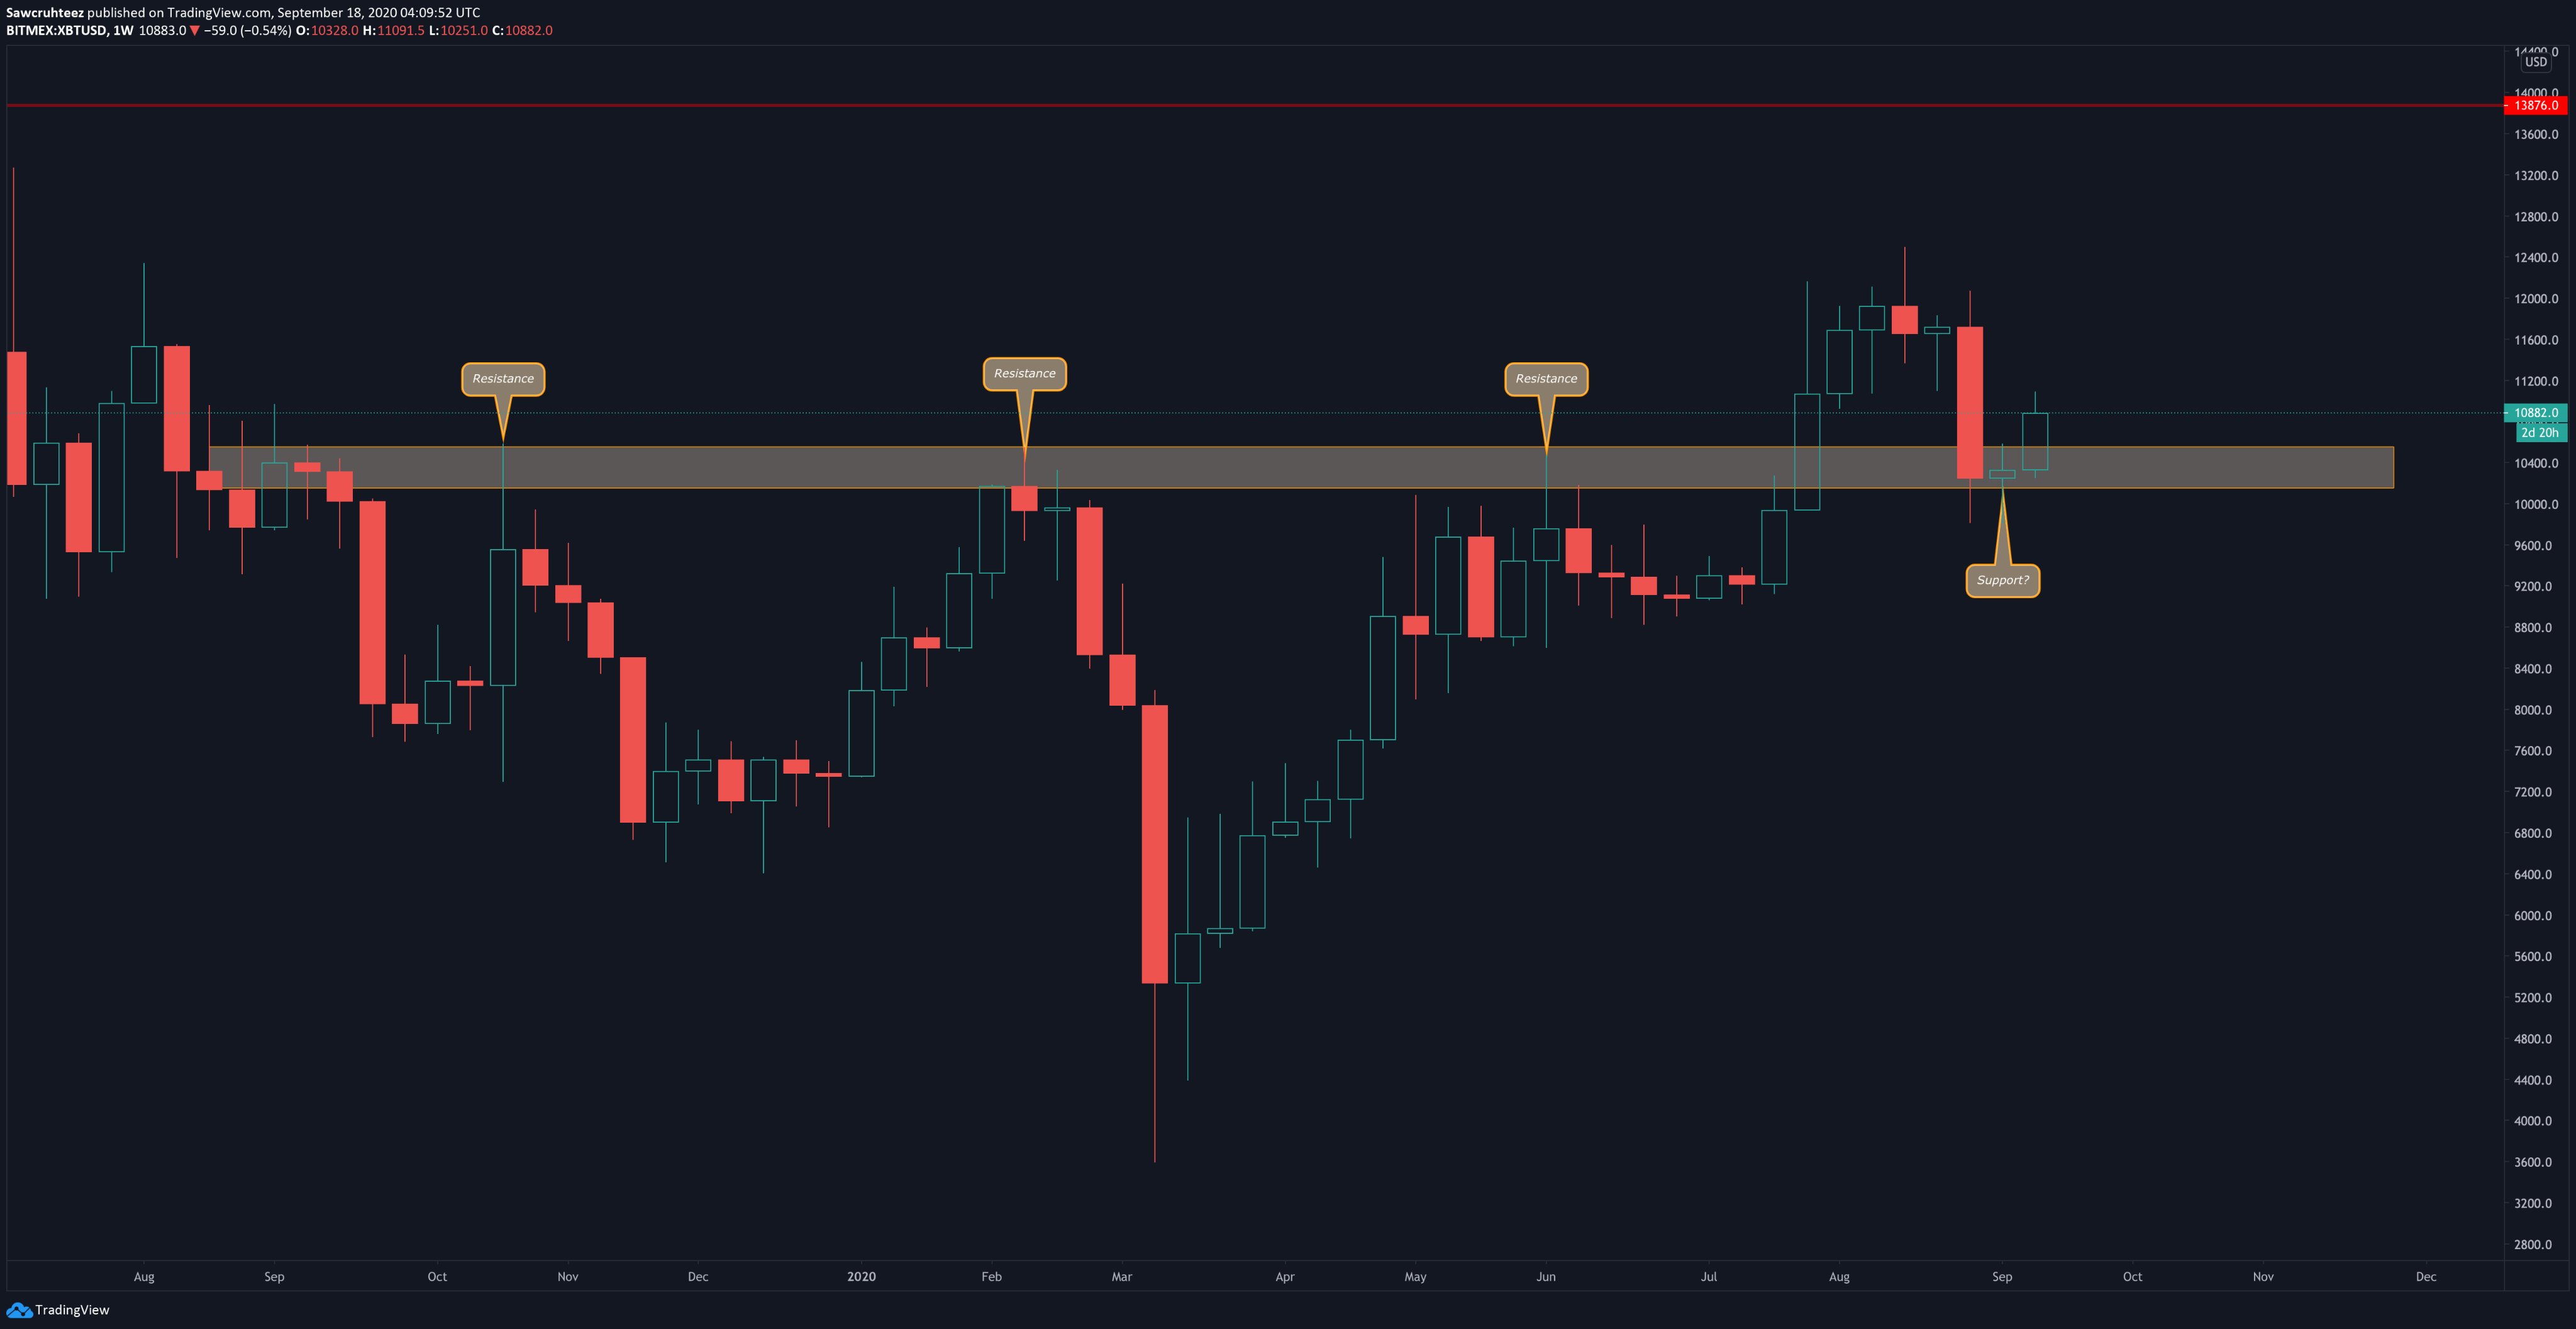
- BTC remains in a positive state on a macro time frame, though, as analysts note that the coin has held a macro support.
- Analysts aren’t counting out short-term weakness, though.
- One analyst recently cited three pivotal technical signs as reasons for asserting short-term bearish sentiment about Bitcoin.
Bitcoin’s Macro Outlook Remains Bullish as Key Support Confirms
Bitcoin’s rejection at $12,000 at the start of this month was far from bullish: $12,000 has long acted as an important horizontal level for the leading cryptocurrency, marking an end to both rallies and corrections.
Despite the technical significance of the correction at $12,000, Bitcoin remains in a positive state on a macro time frame.
Tyler D. Coates, a technical analysis author and Bitcoin market commentator, shared the chart below on September 17th.
It shows that despite recent price weakness, BTC has printed a clean bounce off the macro support from $10,000-10,500. This is important because this zone is where BTC topped during three separate rallies over the past 12 months.
Bitcoin confirming that level as support suggests that the prevailing trend is now bullish.
Chart of BTC's price action over the past year with analysis by crypto trader Tyler D. Coates on Twitter. Chart from TradingView.com
Don’t Count a Short-Term Correction
Analysts aren’t counting out a short-term correction.
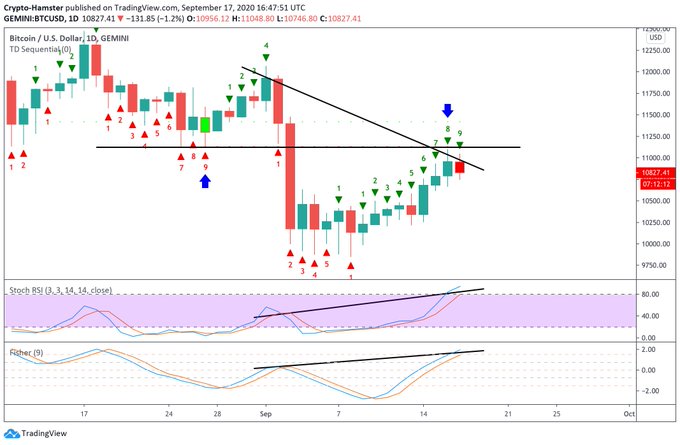
As reported by Bitcoinist previously, one trader noted that there are three pivotal signs suggesting Bitcoin will reverse on a daily time frame. They are as follows:
- Bitcoin has formed a Tom Demark Sequential “Sell 9” candle, seen near the tops of trends or when an asset is poised to put a pause on its uptrend.
- BTC failed to surmount the important technical zone around $11,000, confirming it as resistance.
- Bitcoin has formed a hidden bearish divergence with both its Fisher Transform and Stochastic RSI.
Chart of BTC's price action over the past few weeks with analysis by crypto trader Crypto Hamster (@Cryptohamsterio on Twitter). Chart from TradingView.com
Another factor that could drive BTC lower in the short term is the CME futures gap that sits around $9,600.
Bitcoin has long filled CME futures gaps it has formed within a number of weeks.
It hasn’t been determined why this is the case but should history rhyme, there’s a good likelihood that Bitcoin will retest the $9,600 region in the following weeks or months.
Featured Image from Shutterstock
Price tags: xbtusd, btcusd, btcusdt
Charts from Tradingview.com
Here's Why Bitcoin's Macro Chart Remains Bullish Despite $12k Rejection


