- Bitcoin is currently in no man’s land from a monthly technical perspective analysts say.
- The cryptocurrency will need to decisively move above $12,000 or below $10,000 to confirm its directionality.
Bitcoin Is in No Man’s Land on a Monthly Time Frame
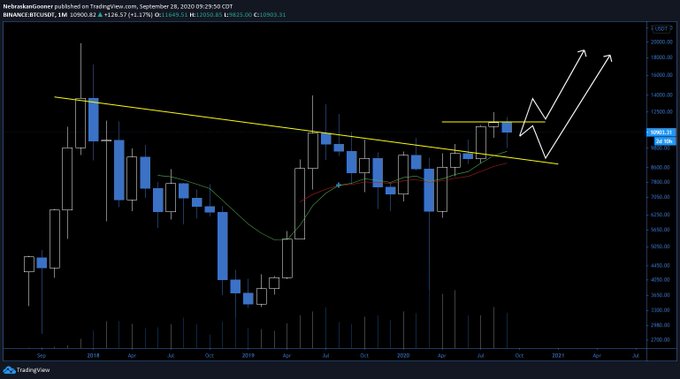
Bitcoin may be in no man’s land on a monthly time frame despite extremely strong price action over the past few weeks and months. One analyst shared the chart below on September 28th, showing that the cryptocurrency is still above a crucial technical support and below a horizontal resistance at $12,000.
The cryptocurrency will need to break past one of these levels to confirm its macro directionality.
Commenting on the chart, the Bitcoin analyst in question wrote:
“Overall I’m bullish unless we close below EMA support. This monthly isn’t necessarily bearish, but it’s not super bullish to me either. This looks like a pattern that will see slow buying up to $11,650 area where I’ll look for rejection or breakthrough.”
Chart of BTC's price action over the past few years with analysis by crypto trader NebraskanGooner (@NebraskanGooner on Twitter)
Chart from TradingView.com
Josh Rager, another crypto analyst, has somewhat echoed the points brought forth by the aforementioned analyst.
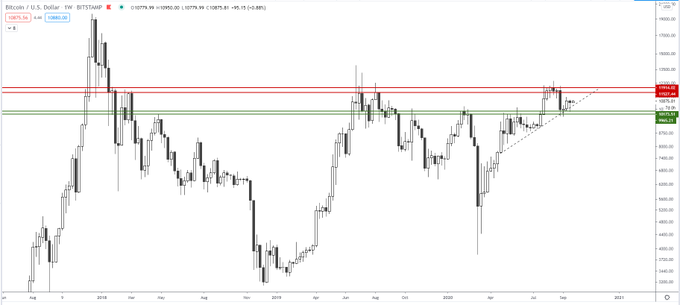
Around the same as the last chart was shared, Rager shared the chart below. It also shows that Bitcoin is caught between two critical levels: a resistance around $12,000 and support around $10,000.
On the chart, the analyst and co-founder of Blockroots explained:
“Weekly close looks good and don’t know why people continue to be overly bearish. Bitcoin got a short term pullback and -20% is nothing unusual. Bitcoin continues to uptrend and for the third week in a row has closed above the support zone of $9900 to $10,175. $11ks next”
Chart of BTC's price action over the past few years with analysis by crypto trader NebraskanGooner (@NebraskanGooner on Twitter)
Chart from TradingView.com
Photo by Vitor Pinto on Unsplash
Price tags: xbtusd, btcusd, btcusdt
Charts from TradingView.com
Here's Why Bitcoin Is in No Man's Land From a Monthly Technical Perspective


