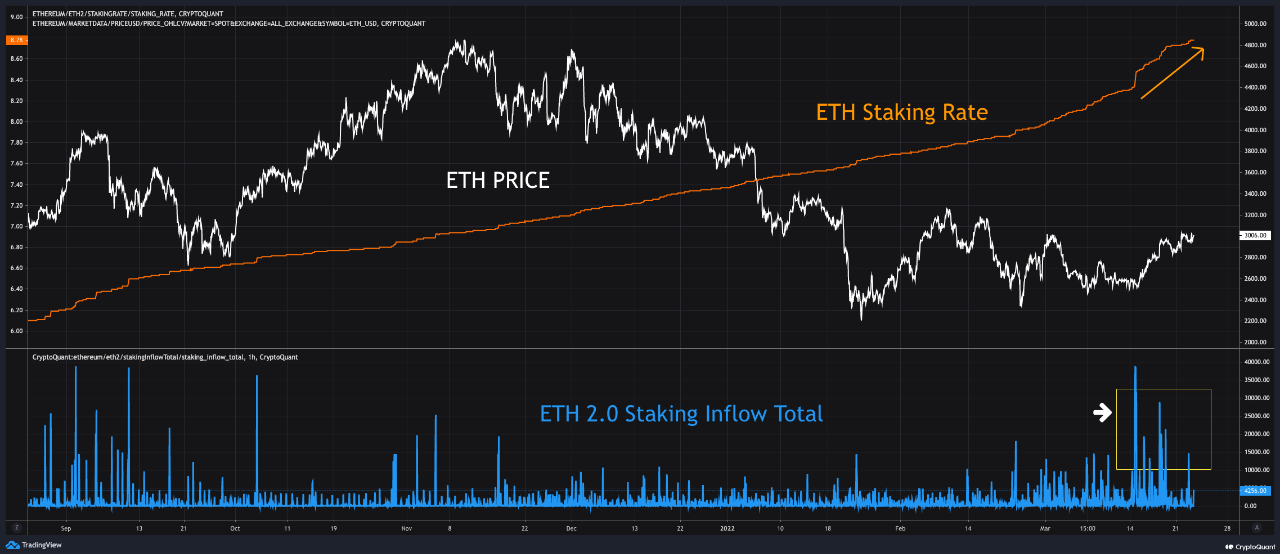
Data shows the staking rate of the Ethereum Proof-of-stake contract (formerly called the ETH 2.0 upgrade) has surged up recently, a sign that could be positive for the crypto’s price.
Ethereum 2.0 Staking Rate Surges Up As Inflows Spike
As pointed out by an analyst in a CryptoQuant post, the ETH staking rate has observed a sharp increase recently as inflows have spiked up.
The “staking rate” is an indicator that measures the percentage of the total Ethereum supply currently locked into the staking contract.
Another metric, the “ETH 2.0 inflow,” tells us about the total amount of coins flowing into the contract in any given time period.
When the value of this indicator spikes up, it means a lot of Ethereum is moving into the staking contract right now.
Sustained such trend can be bullish for the price of the crypto as it means the available supply of the coin is going down since more ETH is becoming locked into the 2.0 contract.
Related Reading | Ethereum Whale Snaps Up $6 Million Worth Of SHIB As Accumulation Trend Continues
Now, here is a chart that shows the trend in the ETH staking rate as well as the inflows over the past six months:

Looks like the values of the metrics have gone up recently | Source: CryptoQuant
As you can see in the above graph, the Ethereum staking rate has observed a rapid rise in the recent weeks. This means that more of the ETH supply is locked into the contract now.
This trend can also be seen in the ETH 2.0 inflows, which have also observed large values recently. These coins entering into the contract have meant that around 9% of the total supply of the crypto is now locked into staking.
Related Reading | US, EU, Or Asia? Here’s Which Of These Has Dominated Bitcoin Sell-Side Recently
As explained earlier, this trend can be bullish for the coin’s price due to demand-supply dynamics. The selling supply of the coin essentially reduces as more Ethereum is held stationary in the contract.
ETH Price
At the time of writing, Ethereum’s price floats around $3k, up 5% in the last seven days. Over the past month, the crypto has gained 17% in value.
The below chart shows the trend in the price of the coin over the last five days.

The ETH price seems to have shot up over the past couple of days | Source: ETHUSD on TradingView
After struggling for most of the month so far, Ethereum looks to have finally broke above the $3k mark again. But it remains to be seen whether the crypto can gain ground above the level this time, or if it will dwindle back down just like earlier in the month.
Featured image from Unsplash.com, charts from TradingView.com, CryptoQuant.com


