
Altcoins like Ethereum are often thought as experiment labs for the possibilities of what changes could eventually be brought to Bitcoin. These changes are often done through a hard fork, a non-backward-compatible upgrade that separates a digital currency into two chains, one with the changes and one without. Miners and users decide which is more relevant, simply by using whichever chain they prefer. One chain thrives and the other dies due to lack of network support. Altcoins have also had relatively smaller market capitalization compared to Bitcoin, which means there are fewer consequences for big, risky changes or endeavors.
For traders or investors, this uneasy footing is certainly something to avoid on the short-term, but those with a healthy appetite for risk may look for these opportunities.
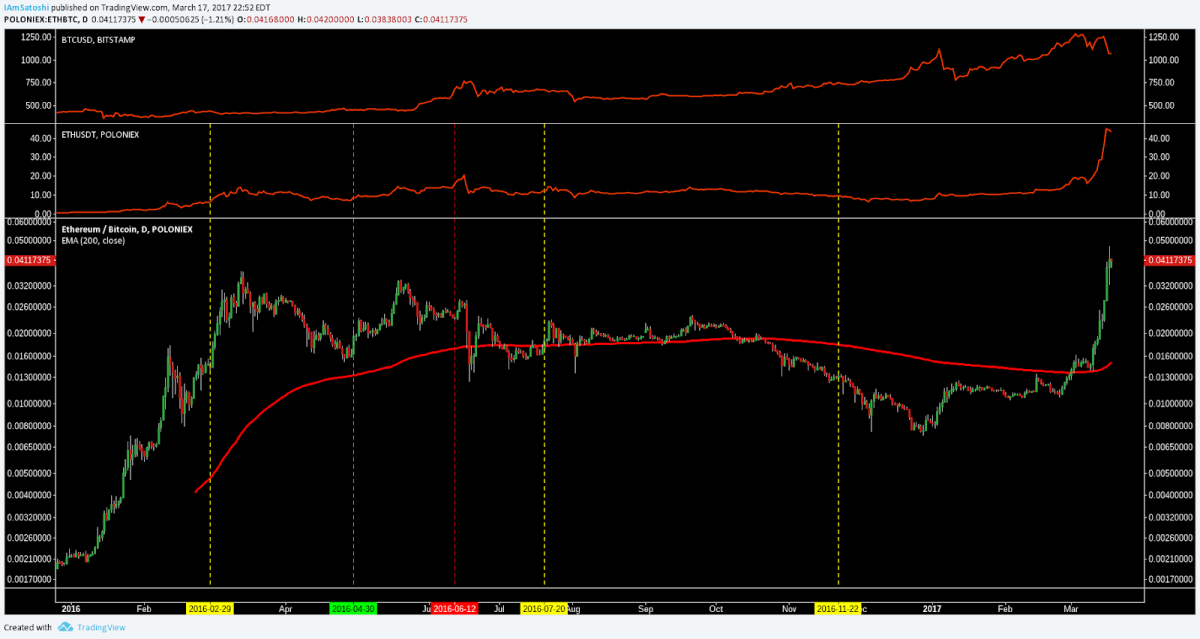
This week, Ethereum (ETH) hit an all-time high (ATH) in USD terms as well as in total market capitalization, ETH/BTC ratio and ETH/USD price. To understand how ETH got here, let’s take a quick look back at the events that took place in 2016. I’ve added a 200-day estimated moving average (EMA) to the chart, which is the fool-proof gold standard for trend determination. Price above the 200 EMA suggests bullish sentiment, and price below suggests bearish sentiment.
02/29/16 — Second hard fork to allow for further protocol changes
03/13/16 — Technical three drives into ETH/BTC ATH completes
04/26/16 — 50 percent pullback
04/30/16 — Decentralized Autonomous Organization (DAO) begins
06/12/16 — DAO hacked
07/20/16 — Third hard fork to reverse DAO hack
10/11/16 — Price falls below 200 EMA
11/22/16 — Fourth hard fork to prevent denial-of-service (DoS) attacks
03/01/17 — Price breaks 200 EMA
03/16/17 — ETH/BTC makes a new ATH
After ETH/USD broke the $2 mark in early February 2016, technicals drove price to an ATH with a three-drive pattern.
As Bitcoin was making a new ATH in March 2017, ETH followed suit as well after breaking the technical resistance of the 200 EMA. Between the creation of the DAO and several hard forks, it’s likely that many investors stayed out of the coin based on the fear, uncertainty and doubt that multiple hard forks and ongoing DoS attacks bring to a digital currency in its nascent stages. Hard forks, from a trader’s perspective, mean two things:
1. Events have occurred requiring drastic changes to the network;
2. Changes can be untested and messy after the hard fork occurs.
This doesn’t mean catastrophe will strike, but the mere possibility opens the door for unintended consequences, which isn’t exactly inviting when risking thousands of dollars trading an asset. I mention all of this because only after a period of stability was ETH able to continue its bull run to the current levels.
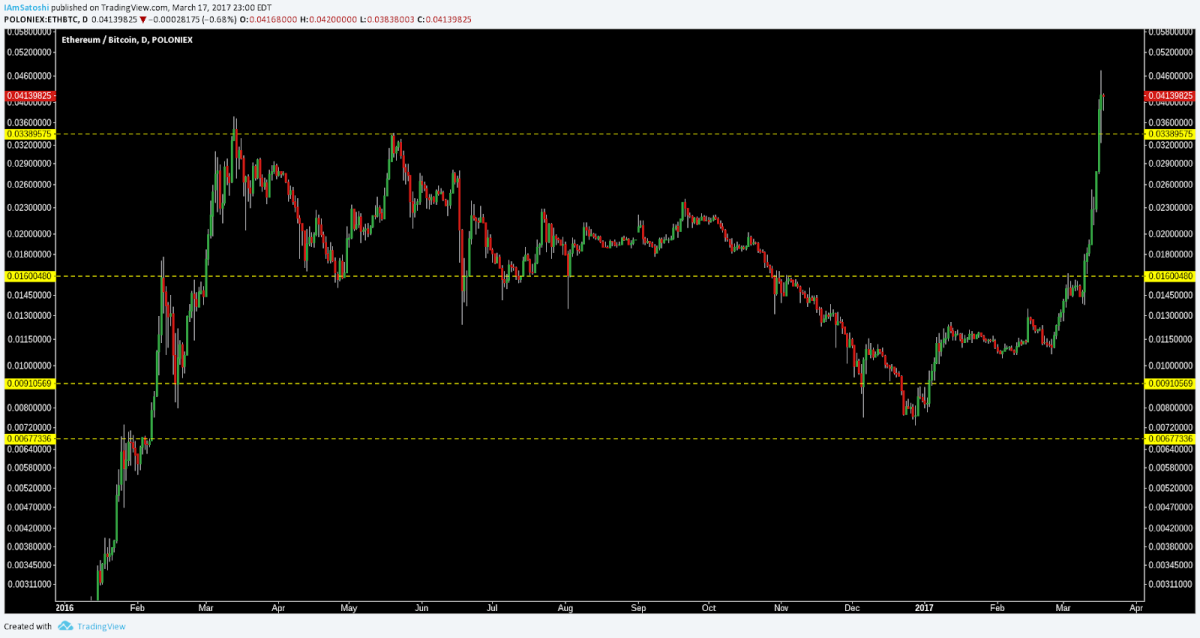
Based on the market memory principle, ETH/BTC was able to find horizontal support from the previous three drives in early 2016. With the addition of a fiat on-ramp through Coinbase on July 21, 2016, it was perhaps inevitable that, given the chance during a period of network stability and an influx of new users, the ETH/BTC ratio would again break the 200 EMA.
The obvious questions now are:
- Is ETH stable at these prices?
- Will ETH continue making ATHs?
- Will ETH pull back?
- Is this an ETH bubble?
Let’s try to answer those questions by adding a pitchfork for diagonal support and resistance, which is drawn from extreme highs and lows of a trend, and pivots, which are mathematical support and resistance levels based on previous price.
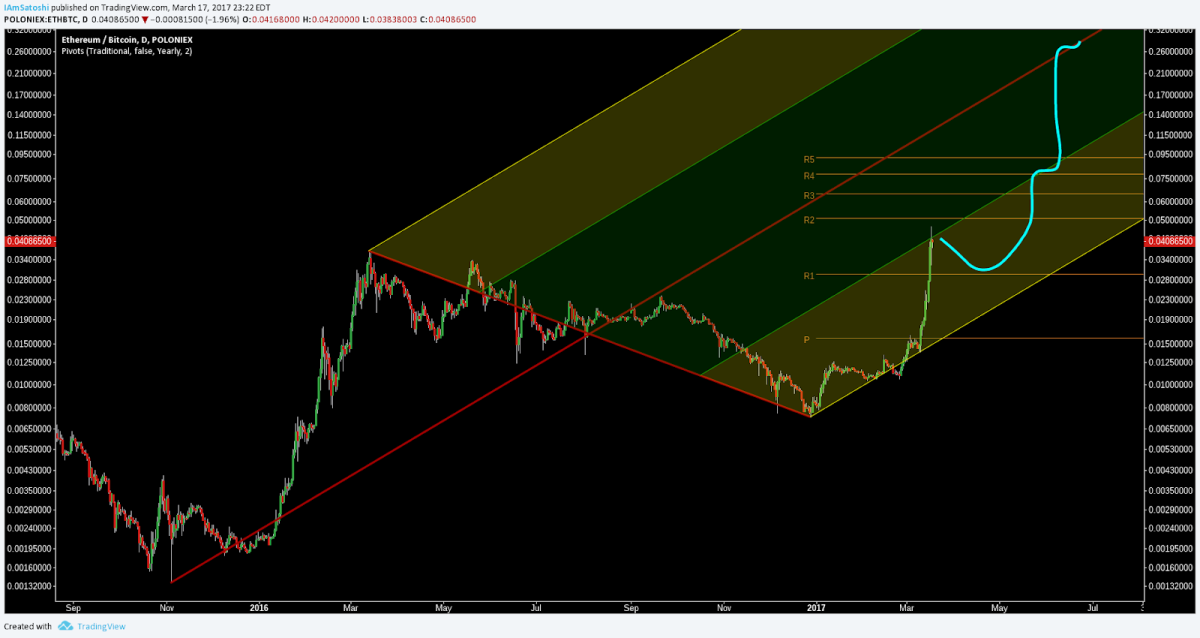
Price is currently sitting at the first expected diagonal resistance of the pitchfork, and very near the yearly R2 pivot. This confluence of resistance is confirmed by the pullback currently in the price. This is a large, young pitchfork. Should it continue, the median line (red) becomes a high-probability target for price. A feasible trajectory (blue) with a pullback to the R1 pivot, or previous ATH, a touch of the pitchfork resistance diagonal and then a reach for the median line is certainly not out of the question.
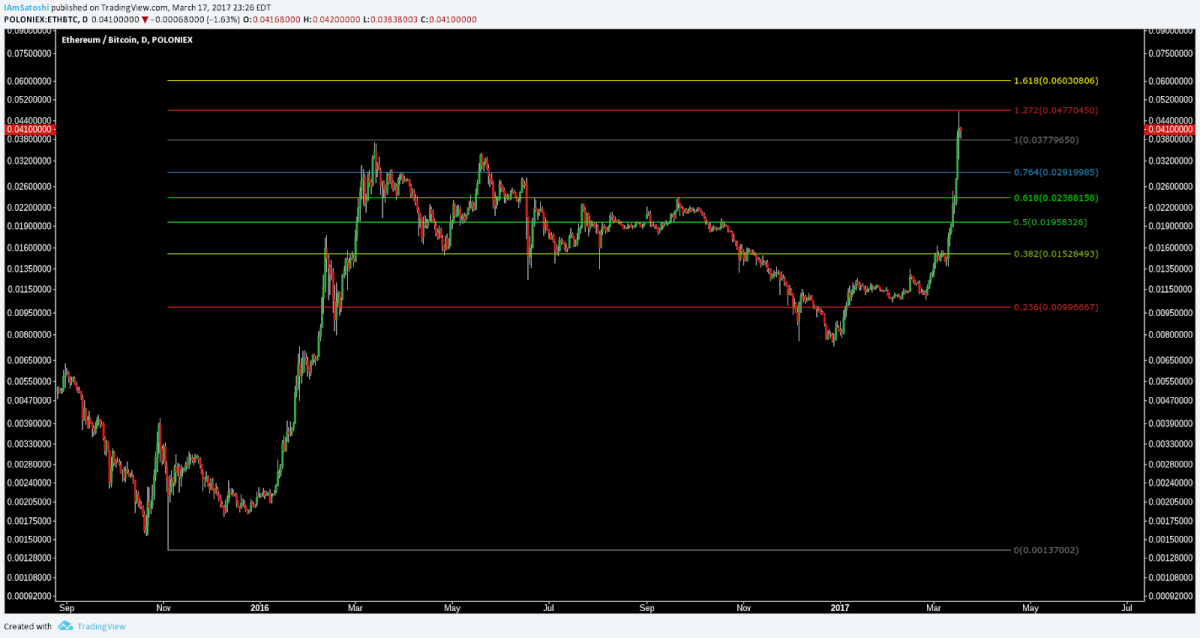
The 1.272 and 1.618 Fibonacci extensions also give further support and resistance possibilities.
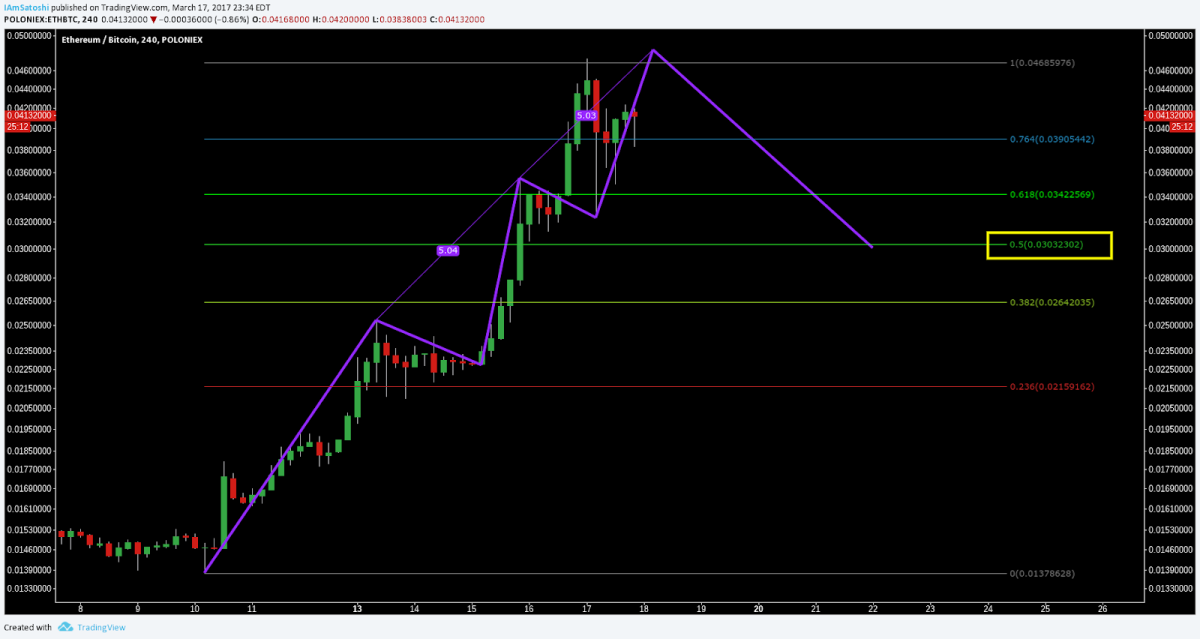
Zooming in to the four-hour time frame, it’s possible that price has set up another three-drive pattern, albeit not perfect, similar to the pattern that led to a then-ATH on March 31, 2016, followed by a 50-percent pullback, yielding a target on ~0.303 ETH/BTC.
Summary
1. After establishing an ATH in 2016 following a three-drive pattern, ETH had a tumultuous year fraught with hard forks, an experiment gone wrong (The DAO) and DoS attacks on the network.
2. Following months of stability and a Bitcoin ATH, ETH was able to break the all-important 200 EMA, creating a technical opportunity for a bullish run.
3. There is a confluence of resistance around the current price level based on pitchfork diagonals, pivots and another possible three-drive pattern. Should this be the local top for the moment, expect a 50 percent pullback of the move to ~0.303 in the near future.