
Ethereum (ETH) continues to hold the number-two market capitalization, despite Ripple and Litecoin making large gains over the past week.

ETH hash rate continues to make higher highs despite price not following suit. Without a supply halving, like Bitcoin, there may be a continuous cycle of new highs, influx of hash rate and subsequent selloff.
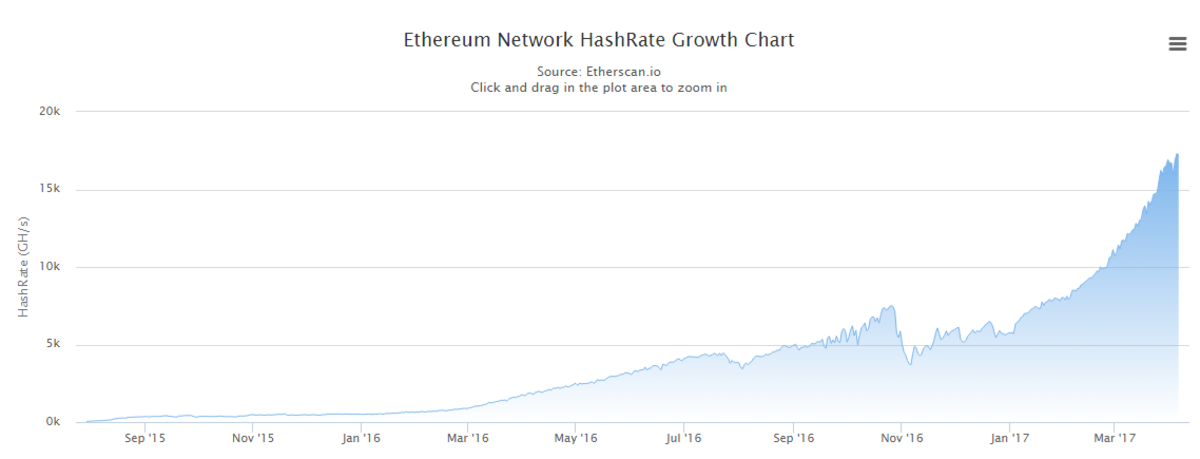
Miners may or may not immediately sell for a profit or loss, but at the very least they’ll need to cover their costs for overhead, such as electricity, rent, hardware and employees. This hurts smaller mining operations to a greater degree because they are able to mine at a loss for a shorter duration than larger operations, thus consolidating mining power even further.
Without a deflationary supply of ETH, there may not be enough to drive the market higher and higher on fundamental developments alone. It is likely too early to tell on the importance or significance of this divergence, but worth watching as ETH gains notoriety.
Grayscale Investments, the company headed by Barry Silbert, who is responsible for the Bitcoin Investment Trust, recently released a report comparing the economic models of Ethereum Classic (ETC) and Ethereum, identifying this very problem, although it is important to acknowledge that Grayscale is likely to release of an ETC Investment Trust in the near future.
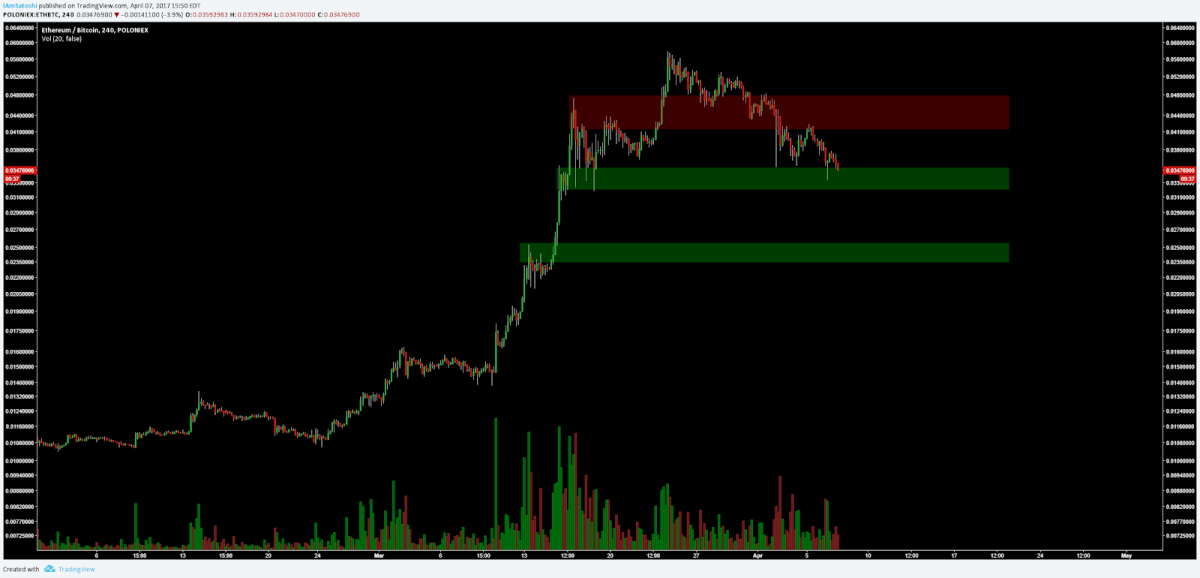
The ETH price has found a horizontal support zone, indicated by previous long candle wicks in the same zone. Should this level fail to support the price, I’d expect a target of the previous bull flag.
There is also an active bearish reversal chart pattern, the head and shoulders, which has now completed. The pattern can be identified through three successive local tops with a descending volume profile. Currently, it is highly suggestive of bearish continuation. The measured move would take the price to ~$14.25 (or 0.01188 BTC), a complete retrace and likely an overestimation of the move.
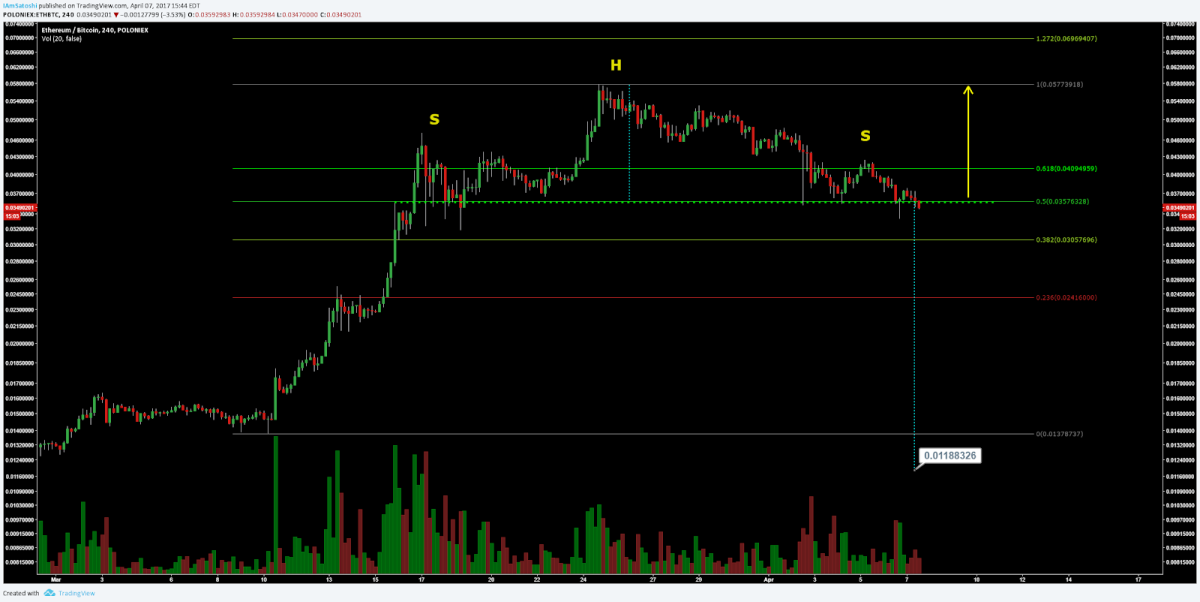
When a pattern forms and does not continue as expected — that is, if this bearish head and shoulders does not break down — expect a retest of local highs.
A candle close to the 50% retracement — or a break of this level — would be another indicator of growing bearish momentum.
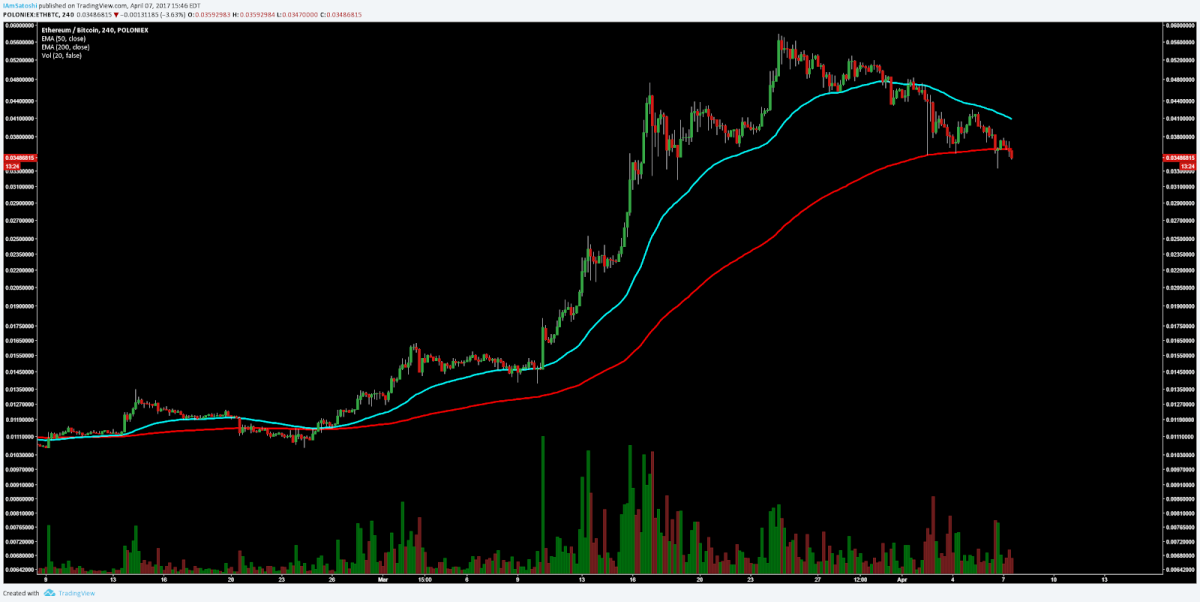
ETH price has also failed to hold support above the 200 EMA for the first time since the beginning of the trend. A 50/200 EMA cross would indicate further bearish momentum as well.
Lastly, on lower timeframes, there is another bearish head-and-shoulders fractal, with a less convincing descending volume profile. A head-and-shoulders pattern on the bottom of a trend is very rare and often suggests strong bearish continuation. The fractal is contained within a falling wedge as well, normally a bullish reversal pattern. Conflicting chart patterns on a lower timeframe are usually superseded by a higher timeframe pattern.
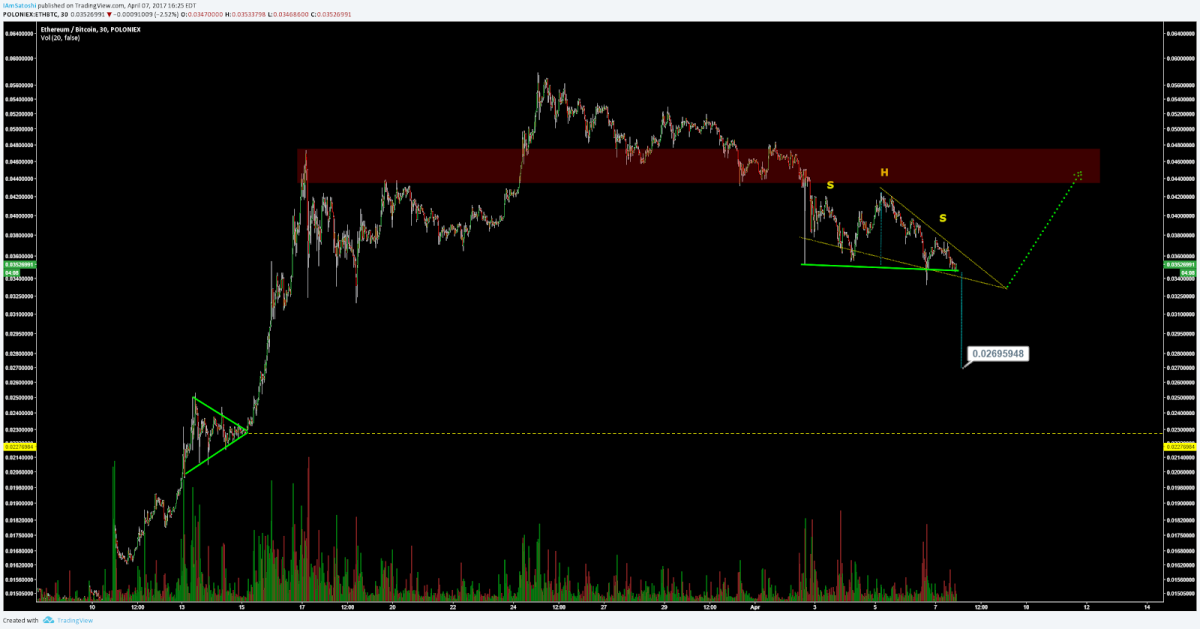
Overall, it is more likely that the head and shoulders on the four-hour timeframe will continue to complete after a throwback to resistance/support driven by the falling wedge.
Summary
- Mining hash rate continues to pour into ETH despite an economic model without a deflationary supply.
- A high timeframe bearish head and shoulders and break of the 200 EMA suggest further bearish momentum is likely.
- The next likely support is between ~$25–29.