- As evidenced by the array of opinions online, many are divided over what’s next for Bitcoin.
- There are some saying that a massive bull is imminent.
- Others believe that a correction back towards $10,500, then lower, is entirely feasible.
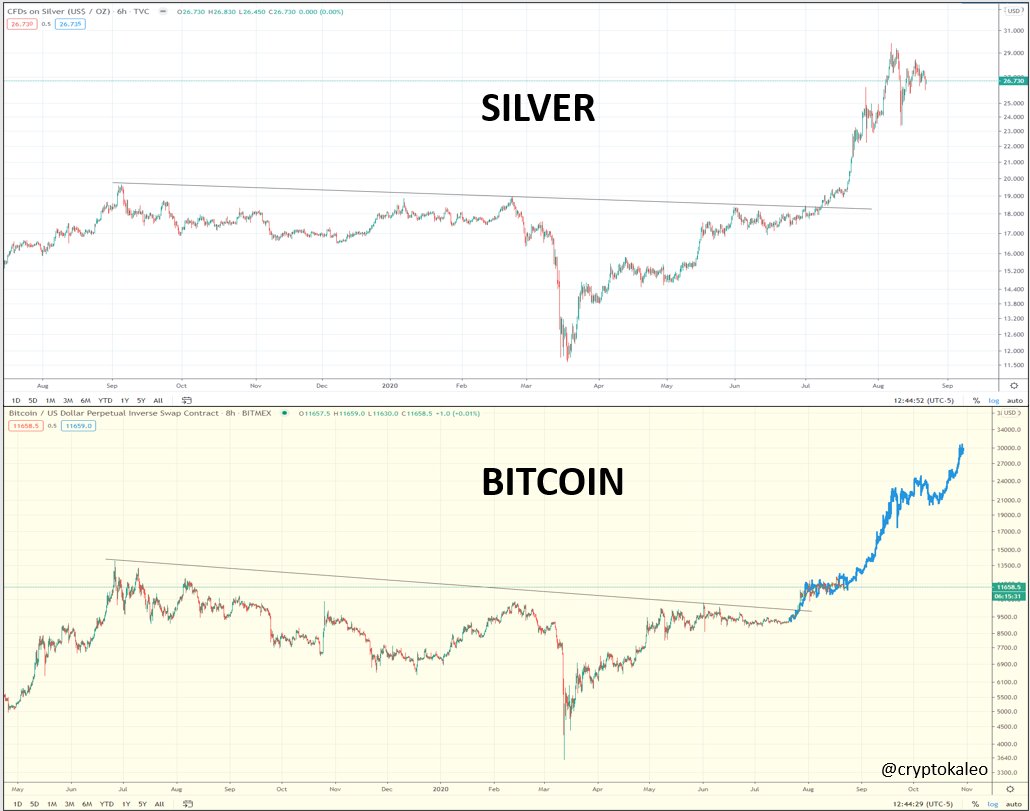
- An eerie fractal that predicted Bitcoin’s ongoing consolidation, though, suggests the trend is bullish.
- The analyst that shared this fractal has been historically accurate, sharing other crucial analyses over the years.
- Bitcoin trades at $11,650 as of this article’s writing, flatlining in the range between $11,500 and $11,700.
Bitcoin Poised to Explode Higher: Silver Fractal
A narrative has formed over recent months that Bitcoin is closely correlated with gold.
But according to a recent analysis shared by a crypto trader, BTC may actually be closely correlated with silver. The issue with this correlation is, silver’s price action is preceding that of Bitcoin by a few weeks.
The trader in question shared the chart on August 23rd. The chart shows that should Bitcoin’s trajectory continue to follow that of silver, the cryptocurrency will soon trade at $20,000. After hitting $20,000, the fractal also suggests that BTC will move to $30,000.
Chart of BTC's price action along with silver's price action over the past year with a fractal analysis by crypto trader KALEO (@CryptoKaleo on Twitter).
Chart from TradingView.com
Few analysts actually expect Bitcoin to hit $30,000 this year, especially in just a few months. But many analysts and investors, like BitMEX’s Arthur Hayes and Galaxy Digital, are adamant that $20,000 will be breached in 2020.
Fundamentals Also Suggest Upside Is Imminent
The fundamentals, like the silver fractal aforementioned, also suggest that Bitcoin is likely to move higher from here.
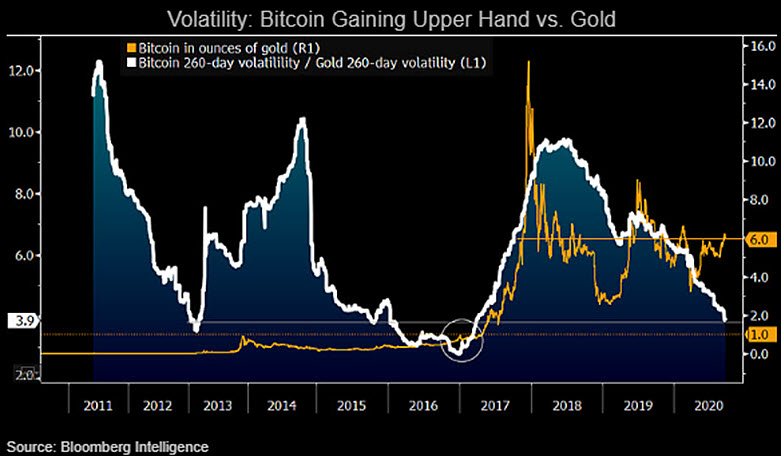
Mike McGlone, the senior commodity analyst at Bloomberg Intelligence, recently said that Bitcoin’s trend of volatility suggests an uptrend is intact:
“Stuck between 3-9x over the past few years, the price of #Bitcoin per ounce of #gold tilts the crypto toward resuming appreciation, if volatility history tells us anything. The Aug. 19 cross rate of 6x is the same as in 2017, yet Bitcoins’s volatility has dropped relative to gold.”
Chart of BTC's price action over the past 10 years with analysis by Mike McGlone, Bloomberg senior commodity analyst
Chart from TradingView.com
McGlone has been touting the Bitcoin bull case for months now.
Also core to his positive sentiment is the influx of investment the cryptocurrency space is seeing, exemplified by institutional money flows through the CME, Grayscale, and other avenues:
“Bloomberg Intelligence Commodity Primer – Something unexpected needs to happen for #Bitcoin’s price to stop doing what it’s been doing for most of the past decade: appreciating. Demand and adoption metrics remain favorable vs. the #crypto asset’s unique attribute of fixed supply.”
McGlone says that Bitcoin could hit $20,000 in 2020, citing the similarities between this market cycle and the last one.
Featured Image from Shutterstock
Price tags: xbtusd, btcusd, btcusdt
Charts from TradingView.com
This Eerie Silver Fractal Predicts Bitcoin Will Soon Shoot Towards $20k


