While Bitcoin is trading more than 150% above its March lows, there have been some doubts that the cryptocurrency is going to enter a full-blown bull run.
Skeptics of the bull case cite trends like the economy, which still remains in a dismal shape despite trillions of dollars worth of stimulus from the world’s governments.
The World Bank estimated that global GDP will drop more than 5%, the largest drop since World War 2. And the Federal Reserve is projecting the worst modern economic slowdown. These trends could suppress Bitcoin as it would deter retail and institutional traders from putting money into a space that they may see as relatively risky compared to, say, bonds.
However, key technical and on-chain signals are showing that the start of a bull run might be nearer than we think.
Related Reading: 3 Macro Factors Show Why Bitcoin Is Poised to Erupt Past $10,500: Analyst
Bitcoin Prints Two Key Signs Showing a Bull Run Is Near
After attempting to break past $10,400 last week, Bitcoin saw a brutal rejection that saw it dump $1,500 in the span of three minutes on a leading exchange.
The drop was far from bullish: $10,500 has been a crucial level for the leading cryptocurrency over the past year, acting as bearish turning points on at least three separate occasions. Bitcoin peaked at $10,500 exactly in February 2020, for instance, before plunging to $3,700 in the month that followed.
Yet there are signs that a full-blown rally is about to begin.
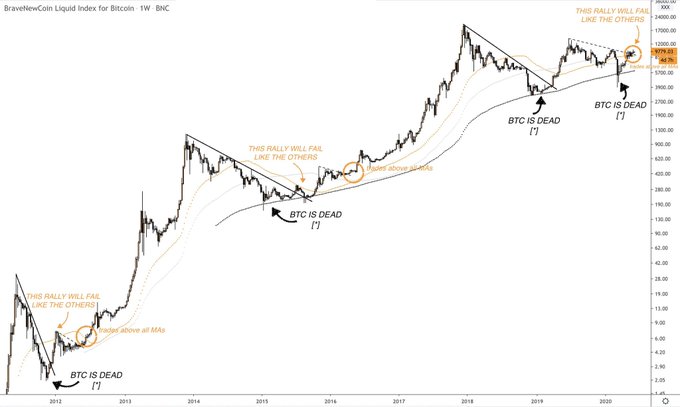
A top trader shared the chart below that illustrates this sentiment on June 10th.
It shows BTC’s macro price action over the past decade along with his annotations.
According to him, the cryptocurrency has just broken above the downtrend that has constrained prices since the $14,000 2019 high, while BTC has also scaled above crucial simple moving averages.

The last two times Bitcoin did this, according to the analyst’s chart, was in the middle of 2016. What followed the middle of 2016, of course, was the parabolic rally that took Bitcoin to $20,000 in the span of 18 months.
On-Chain Metrics Also Signal An Imminent Bull Run
On-chain metrics also show that a bull run is imminent.
As reported by NewsBTC, Hans Hague, a senior quantitative analyst at crypto-asset fund Ikigai Asset Management, found that on-chain metrics show that Bitcoin is in “heavy accumulation.”

Hague added that considering BTC just saw its third halving, what’s likely to follow is market “fireworks.” This was in reference to the fact that the market supply of Bitcoin is dramatically decreasing while demand may be growing, resulting in higher prices.
Other on-chain trends include the health of Bitcoin miners.
After a difficulty adjustment lower last week, miners are back in the game, with BTC’s hash rate nearing an all-time high again. This confirms that “miner capitulation” is over, setting the stage for long-term growth to continue.
Featured Image from Shutterstock
Price tags: xbtusd, btcusd, btcusdt
Bitcoin Prints Two Technical Trends Last Seen at the Start of the Rally to $20,000


