As fast as Bitcoin rallied to $10,000, it crashed.
The cryptocurrency dipped approximately $1,000 in the span of eight hours in a process that liquidated approximately $80 million worth of contracts on BitMEX’s XBT market.
The drop in BTC came alongside a strong correction in the S&P 500 index, which saw its worst daily performance in months. The index dropped 6% during Thursday’s trading session, with its weakness coinciding with that of Bitcoin and other leading asset classes like precious metals and oil.
Despite fears that this is the start of a greater correction in markets, an analyst noted that there are still a number of technical signs showing Bitcoin is bullish.
Bitcoin Is Still Bullish, Technical Analysis Shows
There are many bearish after Bitcoin plunged $1,000 over the past 24 hours. One prominent trader commented that it isn’t unlikely that the crypto drops 40% from current levels:
“BTC. I’ve been seeing more and more comments saying BTC going down to support is unlikely because that’d be too big a drop. That’s not how Bitcoin works. Retraces are short and vicious. Crashes even more so. 40% down is not unlikely, it’s happened before, it’ll happen again,” he stated.
Yet there are still reasons why analysts are betting on upside.
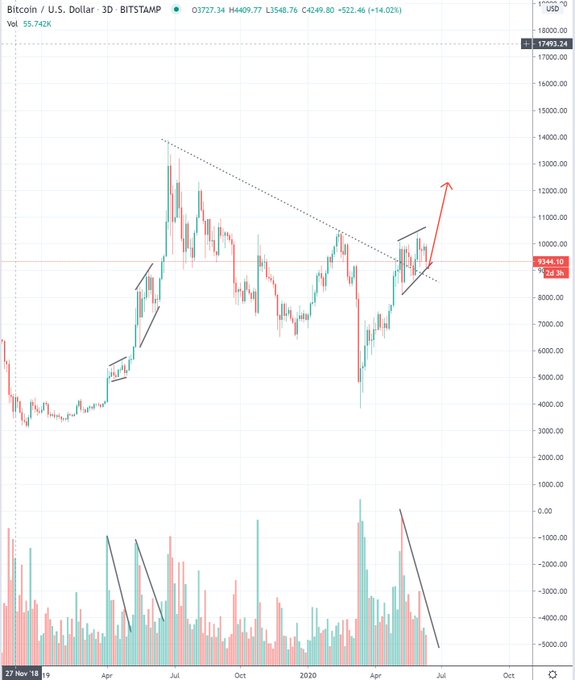
One trader shared the chart below in the wake of the move, asking who is buying the dip after the drop.
Although he didn’t indicate if he is taking a position yet, he pointed to four clear technical signs that the uptrend in Bitcoin’s price is intact:
- BTC is trading above the downtrend that formed after the $14,000 highs in 2019.
- Volume is contracting within a range, suggesting an imminent breakout.
- The recent price action looks extremely similar to 2019’s rally, whereas prices traded in an uptrend channel before going parabolic.
- Bitcoin has yet to print a lower low.

The analyst’s chart indicates that if Bitcoin breaks higher, it could reach $12,000-12,400 by the start of July.
Federal Reserve Rates Could Act as a Tailwind
Adding to the bull case, officials from the Federal Reserve indicated that interest rates will be kept close to zero for the next two and a half years. Jerome Powell, chairman of the Federal Reserve, commented on the central bank’s intentions on supporting the economy when the illness is spreading around the U.S.;
“We are strongly committed to using our tools to do whatever we can and for as long as it takes to provide some relief and stability.”
Bitcoin stands to benefit from this as many believe that extremely low interest rates will promote inflation, especially asset inflation, boosting the value proposition of the scarce BTC.
Featured Image from Shutterstock
Price tags: xbtusd, btcusd, btcusdt
Bitcoin Tanks $1,000: Here Are 4 Pivotal Signs Showing the Uptrend Is Intact


