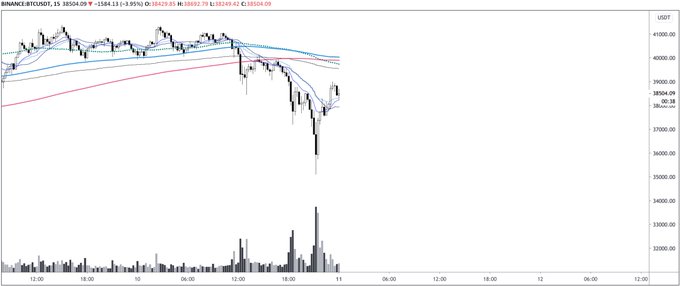
- Bitcoin faced an extreme correction earlier today.
- Over the span of 12 hours, the cryptocurrency plunged from the $41,000 region to lows on spot exchanges close to $34,000 and lows on futures exchanges close to $35,000.
- BTC lost over 15% over the span of this rally.
- The cryptocurrency has since bounced swiftly to the upside, reclaiming a key support level per analysts.
Bitcoin Reclaims Key Support Level After Flash Crash Lower
Bitcoin faced an extreme correction earlier today. Over the span of 12 hours, the cryptocurrency plunged from the $41,000 region to lows on spot exchanges close to $34,000. The cryptocurrency lost over 15% over the span of this rally.
Many thought this was the start of a larger correction. Even when the cryptocurrency was near lows, the funding rates and premiums seen on futures exchanges for BTC were extremely high, implying a continuation to the downside was becoming increasingly likely.
Bitcoin swiftly bounced to the upside, though, as buyers stepped in all at once.
The cryptocurrency has since reclaimed a key support level, according to technical analysts.
One crypto-asset trader shared the chart below after the recovery, noting that Bitcoin had reclaimed a key technical support level on its 15-minute chart. While this is not the end all and be all of support levels, analysts are optimistic that this technical occurrence could help boost the ongoing recovery.
Bitcoin does face some overhead resistance, though, that could put an end to the ongoing recovery.
Chart of BTC's price action over the past few days from crypto asset trader and chartist Pierre (@Pierre_crypt0 on Twitter).
Source: BTCUSD from TradingView.com
Time to Cool Down
On-chain data may show, though, that the ongoing rally is starting to become overheated and that a short-term correction or medium-term consolidation could follow suit. Philip Swift, an on-chain analyst, recently noted that the cryptocurrency is reaching overheated levels per one key on-chain-focused indicator. Referencing the chart below, he said on the matter:
“I am starting to feel that the market is approaching overheated levels now. One data point to observe is MVRV Z-score, which looks at extremes in the data sets between Market Value and Realised Value… We can see that when the z-score enters the red zone it signals a market top. We are not there yet but a few more parabolic days up for price and we will be.”

Bitcoin has long faced corrections during bull markets. In 2017, the coin regularly pulled back by 20-30 percent before moving to new all-time highs.
Featured Image from Shutterstock
Price tags: xbtusd, btcusd, btcusdt
Charts from TradingView.com
Macro Analysis Predicts Bitcoin Has Begun Rally Toward $100k


