
Bitcoin (BTC) upped volatility on June 30 as traders prepared for “interesting” BTC price moves.

Bitcoin bids at the ready below $60,000
Data from Cointelegraph Markets Pro and TradingView followed BTC/USD as it hit intraday highs of $61,668 on Bitstamp.
The pair recovered from local lows of $59,950 the day prior, these marking a fresh dip below the key $60,000 mark amid a feeling of uncertainty over BTC price support.
Now, bids were appearing under spot price with hours to go until the weekly, monthly and quarterly candle close.
“$500M+ in bids were placed below price (but mostly pulled) and open interest going up,” popular trader Daan Crypto Trades wrote in a post on X (formerly Twitter) covering order book liquidity shifts.
“Doubt we'll get our usual weekend price action as mentioned. Quite a lot of action relatively speaking. End of the quarter usually causes some interesting moves.”

The latest data from monitoring resource CoinGlass showed $60,583 as the key downside liquidity level, with a cloud of bids extending toward $59,500.
Liquidity to the upside meanwhile shifted higher as price headed beyond $61,600 on the day.

Despite being down 2.6% week-to-date, meanwhile, Michaël van de Poppe, founder and CEO of trading firm MNTrading, was optimistic about price performance.
“A pretty decent weekly candle for Bitcoin is approaching here,” he told X followers.
“I would expect the correction to be relatively over. We didn't get the most obvious deep corrections in previous cycles either.”

An accompanying chart put the bottom for BTC/USD during its trip to $56,500 at the start of May.
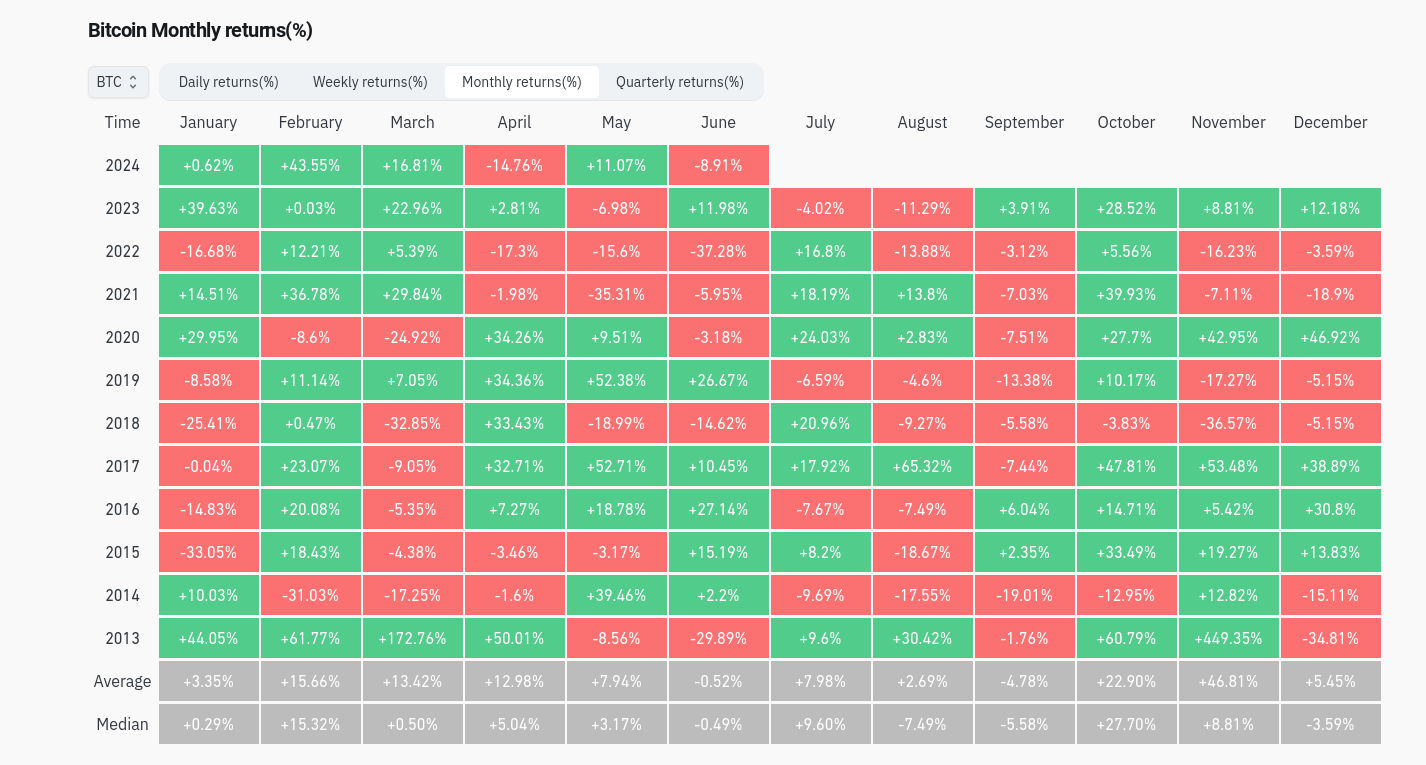
Q2 performance overall remained weak, however, with Bitcoin down 13.8%, with June responsible for 8.9% losses.
Trader delays $95,000 BTC price bet
Elsewhere, ongoing sluggish performance cost one Bitcoin bull his near-term BTC price target.
Related: Bitcoin miner sell pressure ‘weakening’ as BTC withdrawals drop 85%
Acknowledging that the outcome was no longer likely, popular trader BitQuant called time on his expectations of BTC/USD imminently hitting $95,000.
“I was wrong predicting Bitcoin's local top at $49K because Bitcoin reached $48,955, not $49K. I was wrong calling a local top at $75K in January because, first, BTC never reached $75K but reversed at $74,680, and second, it only got there in March. I was wrong then, and I’m wrong now predicting BTC at $95K,” he summarized.
BitQuant nonetheless argued that “nothing has changed” fundamentally, and that at some point, Bitcoin would climb to target.

This article does not contain investment advice or recommendations. Every investment and trading move involves risk, and readers should conduct their own research when making a decision.