
The cost to buy one Bitcoin unit could surpass the $26,000-level according to a textbook bullish indicator forming on its lower timeframe chart.
Dubbed as “Bull Pennant,” the pattern forms when an asset forms a Triangle-like structure after forming an upward flagpole. Traders perceive it as a signal of bias continuation, i.e., they believe the asset would continue in the direction of its previous trend after breaking the Triangle structure.
Bitcoin 1H Chart
Bitcoin is forming a similar Bull Pennant on its one-hour (1H) chart by showing the following characteristics:
- Flagpole: Before forming the Pennant structure, the BTC/USD exchange rate was rallying higher. It resulted in the formation of a flagpole.
- Price Fluctuation: After forming a flagpole top, BTC/USD started consolidating sideways while leaving a trail of lower highs and higher lows behind. That gave it the shape of a triangular structure — the Pennant itself.
- Volume: The volume declined as BTC/USD fluctuated inside the Pennant.
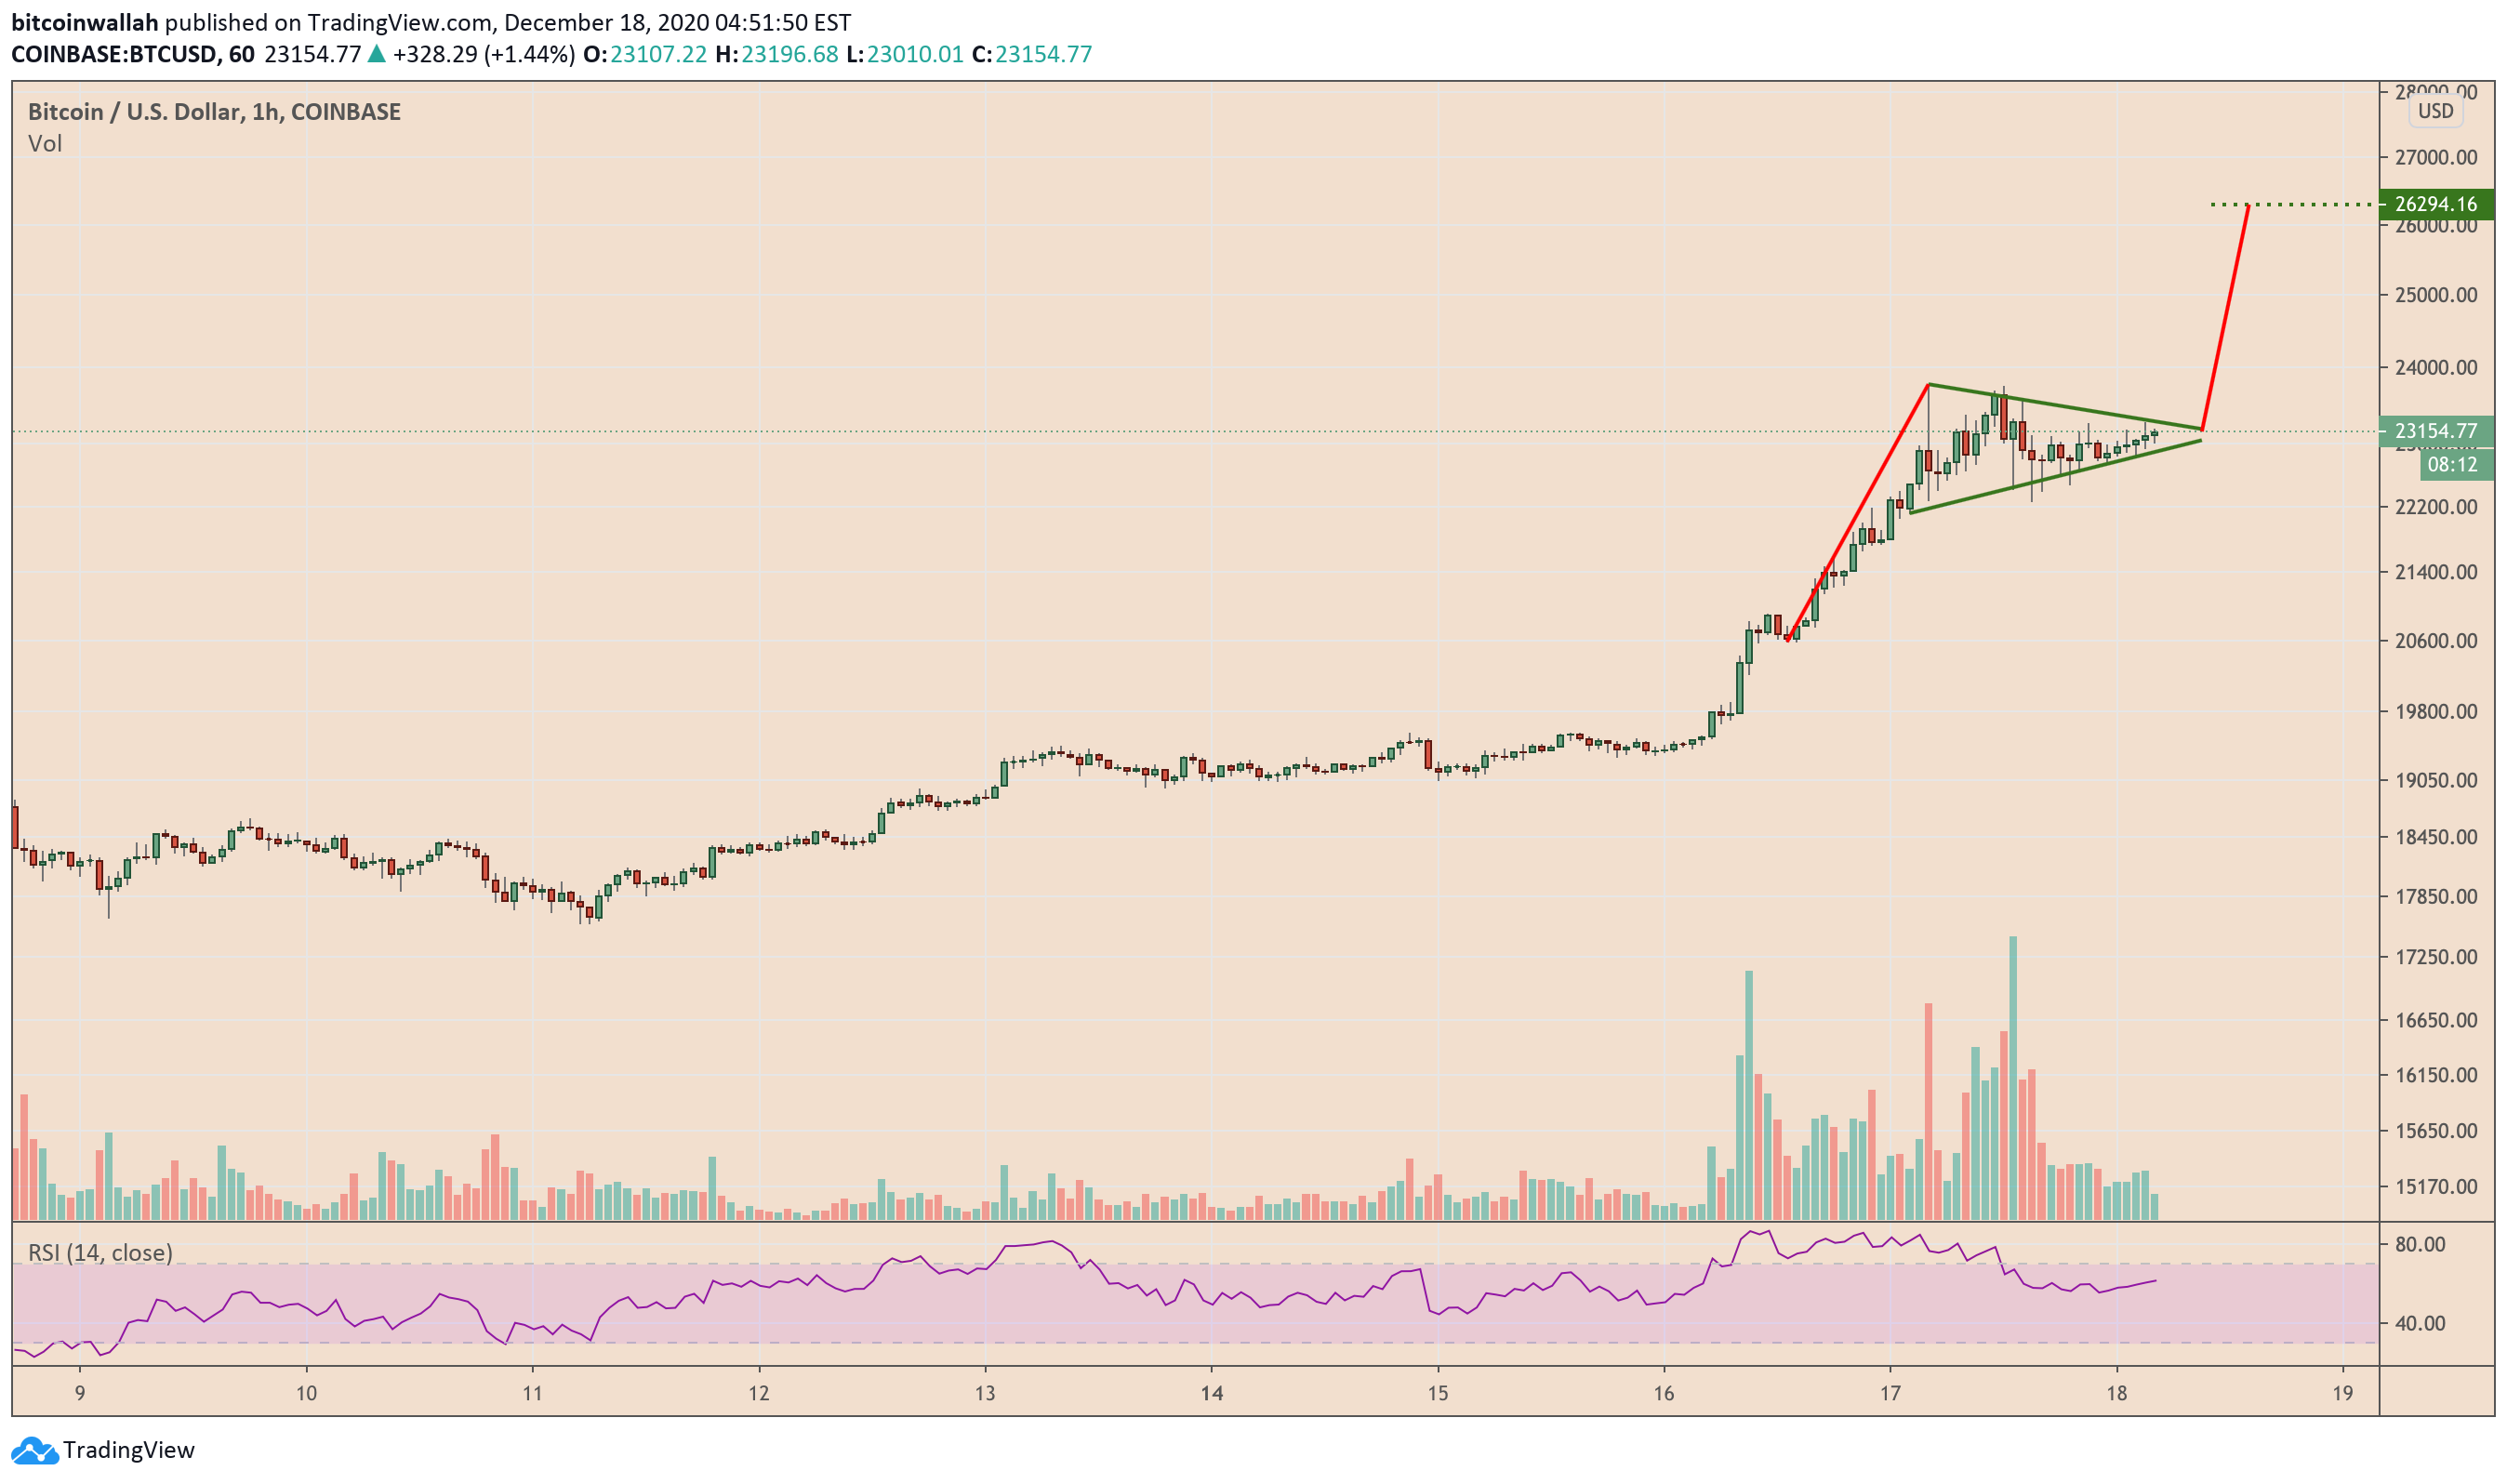
Traders now wait for a break above the Pennant to confirm their extended bullish bias. Should such a move happen, it would shift the upside target by as much as the Flagpole’s height. In the current case, the height is nearly $3,200. That means the breakout move would push BTC/USD at least towards $26,294, as measured from the Pennant’s apex.
Bull Pennants have a 70 percent success rate, according to a study conducted by Samurai Trading Academy. Therefore, there may still be a 30 percent possibility that the current bullish continuation pattern may end up being invalid. Should it happen, the BTC/USD exchange rate would risk correcting lower — again by as much as the Flagpole’s height.
That would roughly bring the pair down to $20,000, the previous resistance target, which now serves as a support level.
Weekly Chart
The long-term timeframe charts support the bearish correction outlook. After logging back-to-back gains, the Bitcoin market now stands overheated. The Relative Strength Indicator on Bitcoin’s weekly chart shows the same with its overbought signals (RSI is above 70).
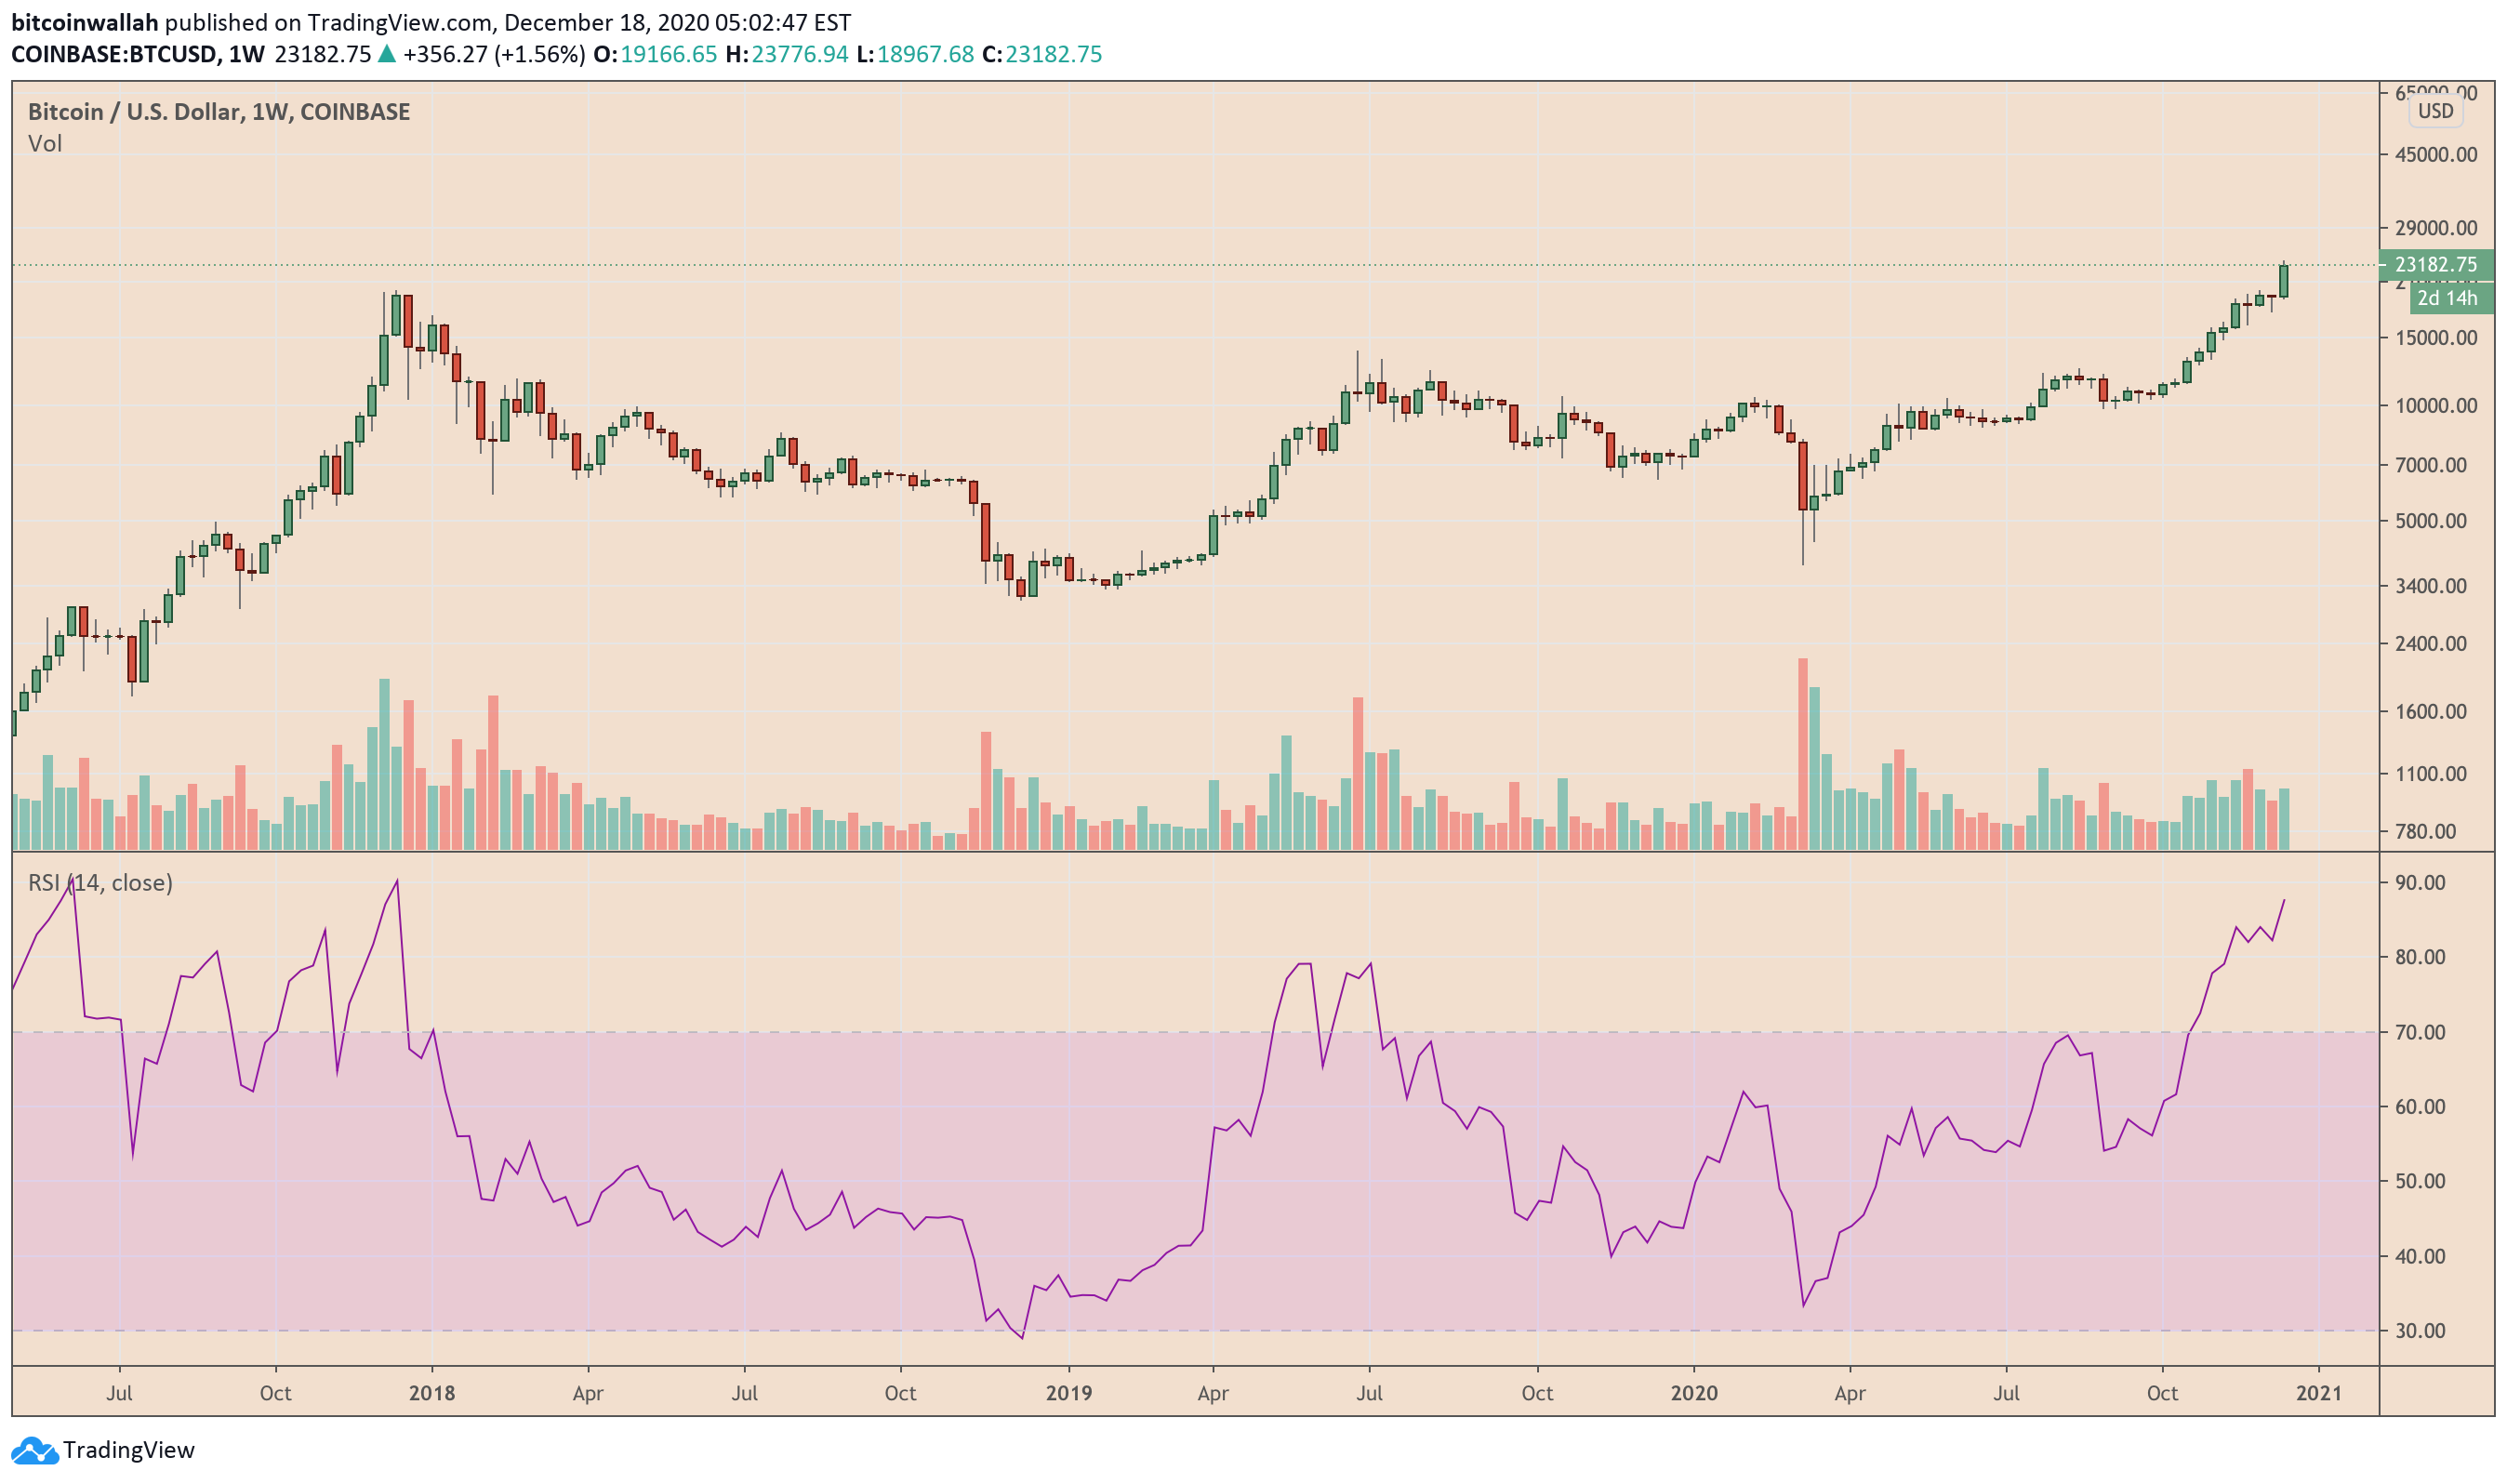
In simple terms, Bitcoin is trading at a higher rate than its ideal bid. That typically leads to neutralizing price moves to the downside. Should it happen, the cryptocurrency risks plunging by at least 20-30 percent to bring its RSI back into the normal zone. That would automatically bring the BTC/USD exchange rate close to/below $20,000.