
On June 10th Bitcoin unexpectedly dropped 10% in less than 4 hours, leaving investors and analysts scratching their heads in search for the reasons behind the slaughter.
Market Overview
Today, we’ll skip all the poetic prose and poorly planned musical puns and just get down to business.
What’s behind the most recent flash crash?
Is it the widening CFTC investigation into cryptocurrency manipulation?
Will cryptonuts finally receive valid information that will confirm or squash the rumor that Tether and Bitfinex work together to flood the market with hundreds of millions of non-dollar backed Tether?
How bad was the Coinrail hack and is it what is driving the cryptocurrency market down?
Or, perhaps this is simply the result of Bitcoin indecisively trading sideways for the last week as the absence of buying appetite and poor volume contribute to the current downturn.
Daily Chart
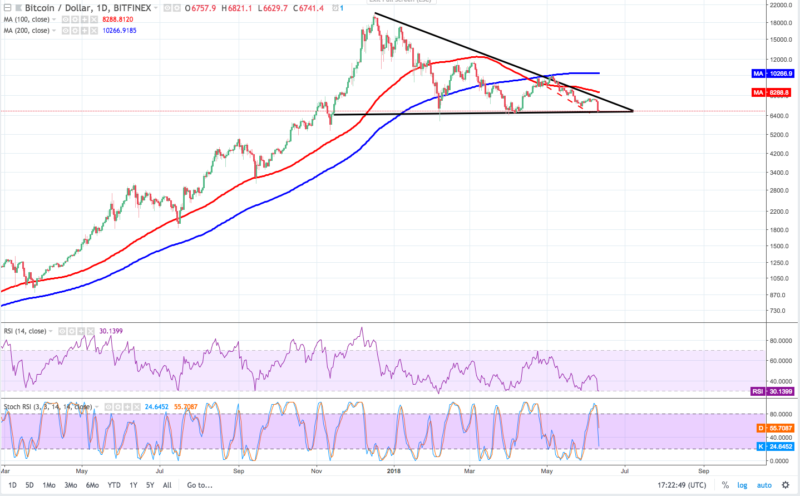
Bitcoin has completed the descending triangle formation and after bottoming at $6,630, it tested and briefly dipped below the very bottom of the triangle. This appears to be the last line of defense for Bitcoin and failure to stay above the line could see the digital currency plummet to new yearly lows.
Exactly how low depends on which analysts one follows or the different technical tools used to construct charts. For example, Tone Vays is calling his “most optimistic” bear target a little below $5,000, while others pinpoint $6,000 as the bottom. The long-term supports for Bitcoin below $7,000 and $6,000 are a little bit depressing so depending on price action, we’ll delay discussing those for a few days to see if BTC can recover.
As seen on the daily chart, the 100 is far below the 200 SMA and, at the time of this writing, all other iterations of the moving average trend downward.
The daily chart shows both the RSI and Stoch deeply oversold in bearish territory, while the 4-hour chart shows a mild change in direction as BTC pushes right under the bottom triangle line at $6,750 but weak purchasing volume is likely to hamper this effort.
4HR Chart
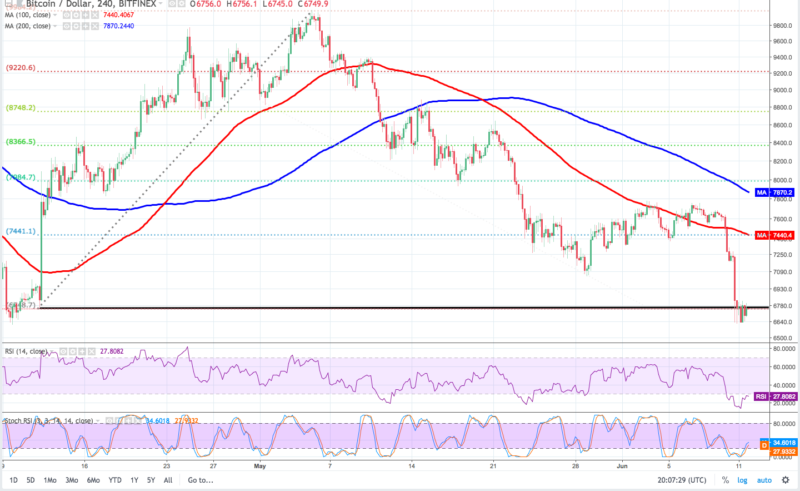
The Fibonacci retracement tool shows a full retrace and BTC has surrendered all gains plus some since the April rally. As long as BTC prices stay below the bottom line of the triangle ($6,766) and below $7,000 there is the risk of a downside break below $6,600.
Bitcoin Price: Looking Ahead

After dallying above and below the bottom triangle line at $6,766, BTC dropped precipitously to $6,435. At the time of writing, the RSI remains in bearish territory and has begun to flatten, while the Stoch has started a descent from overbought territory. Sell volume continues to outpace buyers and it is clear that bears are in full control.
Given the current technical setup, BTC is likely to continue it’s fall to $6,200 – $6,000.
The 38.2% fib retracement of the most recent drop is $7,052.
BTC will remain in trouble as long as it trades below $6,766 which is below 23.6% fib retracement level.
BTC could pop above $7,000 during a corrective rally but traders should not be fooled as technical indicators show a strong downtrend and weak volume will not support a strong recovery in the short term.
So much for that 12th of June prediction…
Updated June 12, 2018 at 9:06 UTC
[Disclaimer: The views expressed in this article are not intended as investment advice. Market data is provided by BITFINEX. The charts for analysis are provided by TradingView.]
Where do you think Bitcoin price will go this week? Let us know in the comments below!
Images courtesy of ShutterStock, Tradingview.com