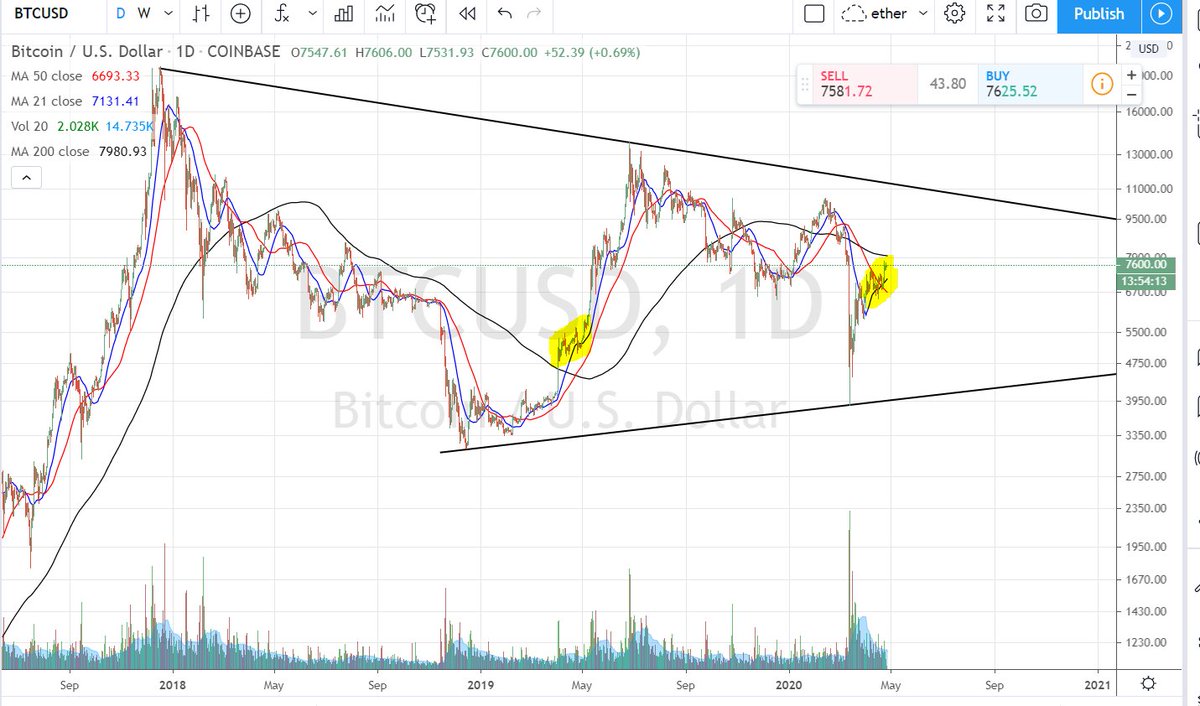
After retracing to $7,490 from the weekly highs, Bitcoin rocketed higher immediately before and after the daily candle close on Sunday, rallying as high as $7,780 just minutes ago as of the time of this article’s writing. This represents a 4% rally from the daily lows.
According to data from Skew.com, analysts and traders were largely unaware that such a move would transpire, with the site reporting that $10 million worth of BitMEX short positions has been liquidated in the past hour alone. This comes after a series of multi-million-dollar liquidation events over the past 48 hours.
With this recent price action, the pressure is building for Bitcoin to set even newer highs in the coming days.
It’s Time for a Bigger Bitcoin Breakout
Matt D’Souza — CEO of Blockware Solutions and a hedge fund manager — recently remarked on Twitter that he is convinced more upside is in the cards.
The crypto investor and executive said that he thinks bears trying to push Bitcoin below the ever-important $7,500 level is “like trying to hold a basketball underwater.” “Don’t fight physics,” he added, referencing his sentiment that it’s almost inevitable BTC pops higher in the coming days and weeks.

The investor added that with March’s crash came a drop in Bitcoin’s mining difficulty and hash rate, which “removes sell pressure from the network.”
“February 2019 marked the bull flag reversal out of the 14-month bear market. April 2020 looks like it could be setting up for a similar breakout. This is your warning. Buy Bitcoin.”
Key Levels Ahead
It’s important to note that there is a risk of a pullback if Bitcoin continues to rally.
As reported by Bitcoinist previously, analyst and technical analysis author Tyler D. Coates noted that BTC is rapidly approaching the bottom of a logarithmic growth curve (~$8,100-$8,300) that has contained all of Bitcoin’s price action for the past nine years.
Considering the importance of this level to Bitcoin from a historical perspective, there’s a high likelihood the curve acts as a crucial resistance moving forward until bulls retake it.
Furthermore, there is a confluence of resistance in the high-$7,000s, which includes a number of simple moving averages and a “golden pocket” Fibonacci Retracement level.
Photo by Jason Wong on Unsplash


