- Bitcoin has begun to break out after flatlining around $11,500-11,700 for a number of days.
- Just hours ago, as reported by Bitcoinist, the cryptocurrency crossed the pivotal $12,000 level.
- While BTC has been slowing around that level, analysts are optimistic.
- They say that the cryptocurrency moving above $12,000 will trigger an even greater move to the upside.
- Analysts are currently eyeing a $13,000 price target for Bitcoin as the $12,000 resistance seems to be falling to bulls.
- Bitcoin bulls may need to watch out for trends in the price of gold and other assets, though. Gold, after all, has effectively dictated BTC’s overall direction over the past few weeks.
Bitcoin Could Soon Move Towards $13,000
As reported by Bitcoinist previously, Bitcoin surged above $12,000 just earlier today for the first time since August 2nd. The move has since stalled around that level, as some bears predicted.
Even still, there remain analysts that think a move to $13,000 for the leading cryptocurrency is imminent.
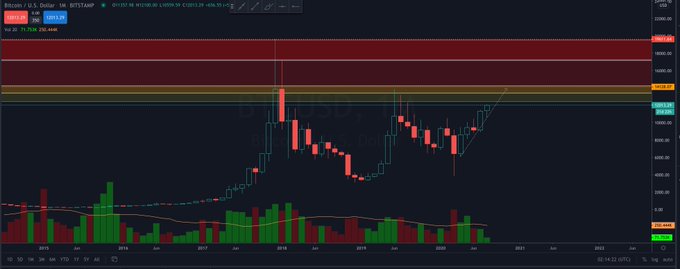
Eric “Parabolic/King” Thies, a cryptocurrency analyst and indicator creator, shared the chart below after the move to $12,000. It shows BTC’s macro price action with long-term resistances to watch out for.
According to him, there is little macro resistance until Bitcoin reaches $13,300 — 10.8% or $1,300 above the current market price.
“$BTC 1M Chart. Current price $12,025. Resistances at $13.3k -> $14.5k -> $17.1k -> $19.5k. Bull run starts at new ATH… $20,000. Lets ride.”
Chart of BTC's macro price action with resistance analysis by Eric "Parabolic/King" Thies, a cryptocurrency analyst and indicator creator. Chart from TradingView.com
The expectation of a move towards $13,000 has been echoed by a pseudonymous analyst.
Bitcoin’s rally above $12,000 today marks a conversion of a bearish market structure into a bullish one, the analyst in question suggested. He added that “$13ks look ripe,” referencing how the rally to $12,100 has formed a higher high in the near term.
The expectations of a move to and potentially beyond this level have further been corroborated by Bitcoin’s weekly price chart. The cryptocurrency closed above $11,500 on Sunday evening, marking the highest weekly close since early-2018.
BTC’s close above $11,500 confirms that a multi-year bear run will not ensue that takes the cryptocurrency to new macro lows.
All Eyes on the Price of An Ounce of Gold
While Bitcoin may be poised to move higher by technical standards, investors should still keep an eye on the price of gold. Over the past few weeks, gold has been leading Bitcoin’s overall trajectory as a correlation has formed.
With the U.S. dollar breaking higher after a strong drop, gold could drop — and Bitcoin may too. BTC may be able to diverge from gold, though, if altcoins can push the leading cryptocurrency to the upside.
Featured Image from Shutterstock
Price tags: xbtusd, btcusd, btcusdt
Charts from TradingView.com
Bitcoin Could Erupt Towards $13k as Market Structure Flips Bullish: Analysts


