- Bitcoin has been bouncing between $10,000 and $10,500 over the past few days.
- Both buyers and sellers have been trying to assert dominance, resulting in multiple tests of both range boundaries.
- BTC finally broke above $10,500 just minutes ago.
- The leading cryptocurrency has had quite the history with $10,500.
- Bitcoin was rejected multiple times by that level over the past 12 months.
- Analysts are optimistic, but it is worth noting that this is a weekend rally.
- Weekend rallies often retrace due to the CME futures narrative.
Bitcoin Breaks Above $10,500
Bitcoin is starting to wake up after consolidating in a $500 range for the past five days. The leading cryptocurrency just minutes ago crossed above $10,500 for the first time in many days in a $100 candle that came on the back of liquidations.
According to Skew.com, a crypto derivatives tracker, around $6 million was liquidated during Bitcoin’s move higher. This was only for BitMEX’s BTC market, meaning millions more were likely liquidated.
Other markets, like those for Ethereum and other altcoins, also likely saw millions in liquidations as they moved higher.
Chart of BTC's price action over the past few days from TradingView.com
What’s Next for BTC?
Analysts are optimistic about what comes next for Bitcoin.
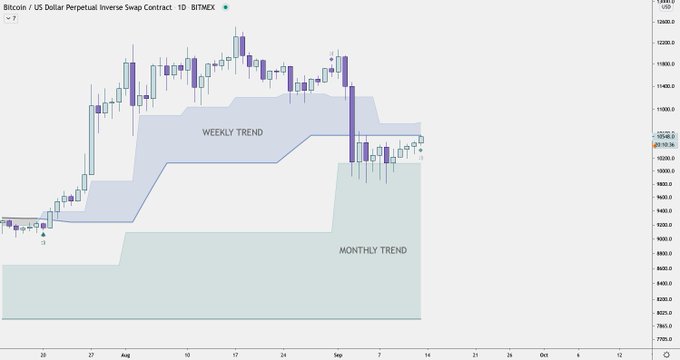
One crypto trader shared the chart below, which shows the recent price action over the past few weeks. The trader’s proprietary indicator just formed a buy signal on the daily candle; this signal was last seen at the end of July, in the low-$9,000s.
The indicator also formed a sell signal just two days prior to the flash dump from the $12,000 highs to $10,000.
Chart of BTC's price action over the past few weeks with analysis by Stackin' Bits (@StackinBits on Twitter). Chart from TradingView.com
The chart also indicates that Bitcoin has cleanly bounced off a monthly trend level, which is bullish. It also shows that BTC is running up against a weekly trend, though, suggesting that bulls still have some work to do.
Another trader that predicted the ongoing retracement also suggested that there is little reason to short Bitcoin from here. He suggested that the coin could move “closer to $11,000,” which is where the next notable level of resistance lies.
Featured Image from Shutterstock
Price tags: xbtusd, btcusd, btcusdt
Charts from TradingView.com
Bitcoin Breaks Above $10,500 as Bullish Recovery Continues: What Comes Next?


