Just days ago, Bitcoin saw its latest block reward reduction when the 630,000th block was mined into existence. This immediately lowered the inflation rate of BTC by 50%, making the cryptocurrency more scarce than gold and most fiat currencies.
Some have feared a “sell the news” event, whereas Bitcoin would crash after the halving. Meltem Demirors of CoinShares, for instance, told Bloomberg a week out from the halving:
“We are seeing some enthusiasm around bitcoin as it breaks $8k, but we are still watching closely and believe the sentiment is not yet bullish,” said Demirors. “I expect Bitcoin will see more trading activity around the halving — most likely ‘buy the rumor, sell the news’.”
Yet a key on-chain indicator shows that the cryptocurrency is printing an on-chain signal that has acted as a bottoming sign for the past eight years.
Bitcoin Prints Historical Bottoming Sign
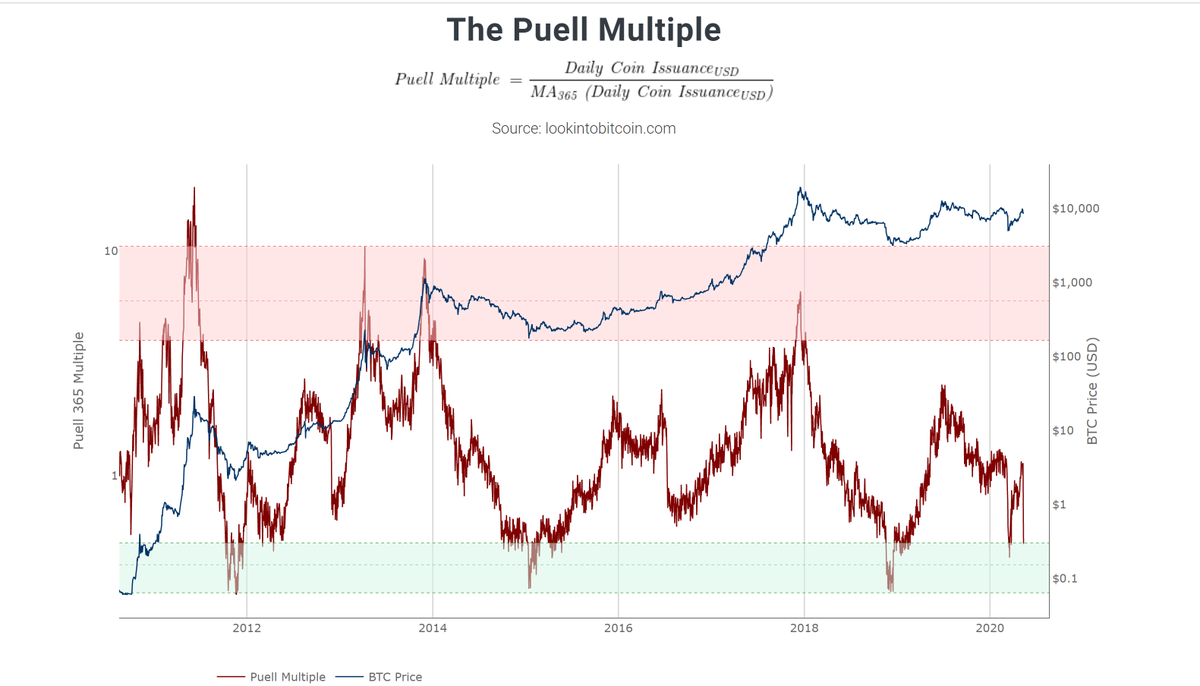
According to data shared by on-chain analyst Philip Swift, The Puell Multiple — an on-chain metric that is the USD value of BTC issued per day over the one-year moving average of the same metric — just reached a key zone.

As can be seen in the chart above, the Multiple recently entered the green band seen at the bottom of the chart, which is the level at which the Multiple reached when Bitcoin found macro bottoms.
When BTC crashed to $3,700 this year, the Multiple reached the green band; furthermore, Bitcoin bottomed at $3,150 when the Multiple fell to the bottom of the green band in late 2018.
This historical precedent suggests that Bitcoin is nearing a post-halving bottom and is about to embark on a long-term rally.
Watch Out for Capitulation
Although the drop in miner revenues has allowed Bitcoin to print the key on-chain signal, some fear that “extreme capitulation” amongst miners is imminent.
Matt D’Souza, chief executive of Bitcoin mining firm Blockware Solutions and a crypto hedge fund manager, remarked on May 11th that investors should expect “extreme capitulation” if BTC trades sideways.
D’Souza indicated that per his firm’s data, 30% of the network is mining at breakeven cost at ~$8,500, making a move above this level critical for miners to stay in operation.
Digital asset manager Charles Edwards echoed this sentiment, writing that per his analysis, the electrical cost to mine one Bitcoin alone is “somewhere [around] $9,000 today.”
15/
Where does that leave us now?Given a good chance of lowered electrical prices, Electrical Cost is likely somewhere between $9K today. These are best estimates.
This suggests that the average Bitcoin miner is unprofitable.
They are losing money on to run their business.
— Charles Edwards (@caprioleio) May 12, 2020
This is important as some suggest that a “miner capitulation” is purportedly what caused BTC to crash from the $6,000s to $3,150 in November and December of 2018.
So while Bitcoin’s long-term outlook as indicated by the Puell Multiple may be more bullish than ever before, the crypto market may be subject to a short-term drop in preparation for a long-term rally. As put best by D’Souza:
“We are going to witness a Healthy Cleanse of the network. Miners will be forced to deploy into more efficient equipment over the coming months. […] Pruning of Inefficient Miners = better environment to rally.”
Photo by Kieran White on Unsplash


