Data shows the combined trading volume of Bitcoin and the altcoins have hit the lowest value in more than a year. Here’s what this may mean.
7-Day Volumes Across The Cryptocurrency Market Have Dropped Recently
According to data from the on-chain analytics firm Santiment, the volumes were last at any significant levels back in March of this year. The “trading volume” is an indicator that measures the daily total amount of a given asset that’s being moved around on the blockchain.
When the value of this metric is high, it means the cryptocurrency in question is observing the movement of a high number of coins right now. Such a trend suggests that the investors are actively trading in the market currently.
On the other hand, low values of the indicator can be a sign that there isn’t much interest in the asset among the investors at the moment, as they aren’t taking part in any significant transaction activity on the network.
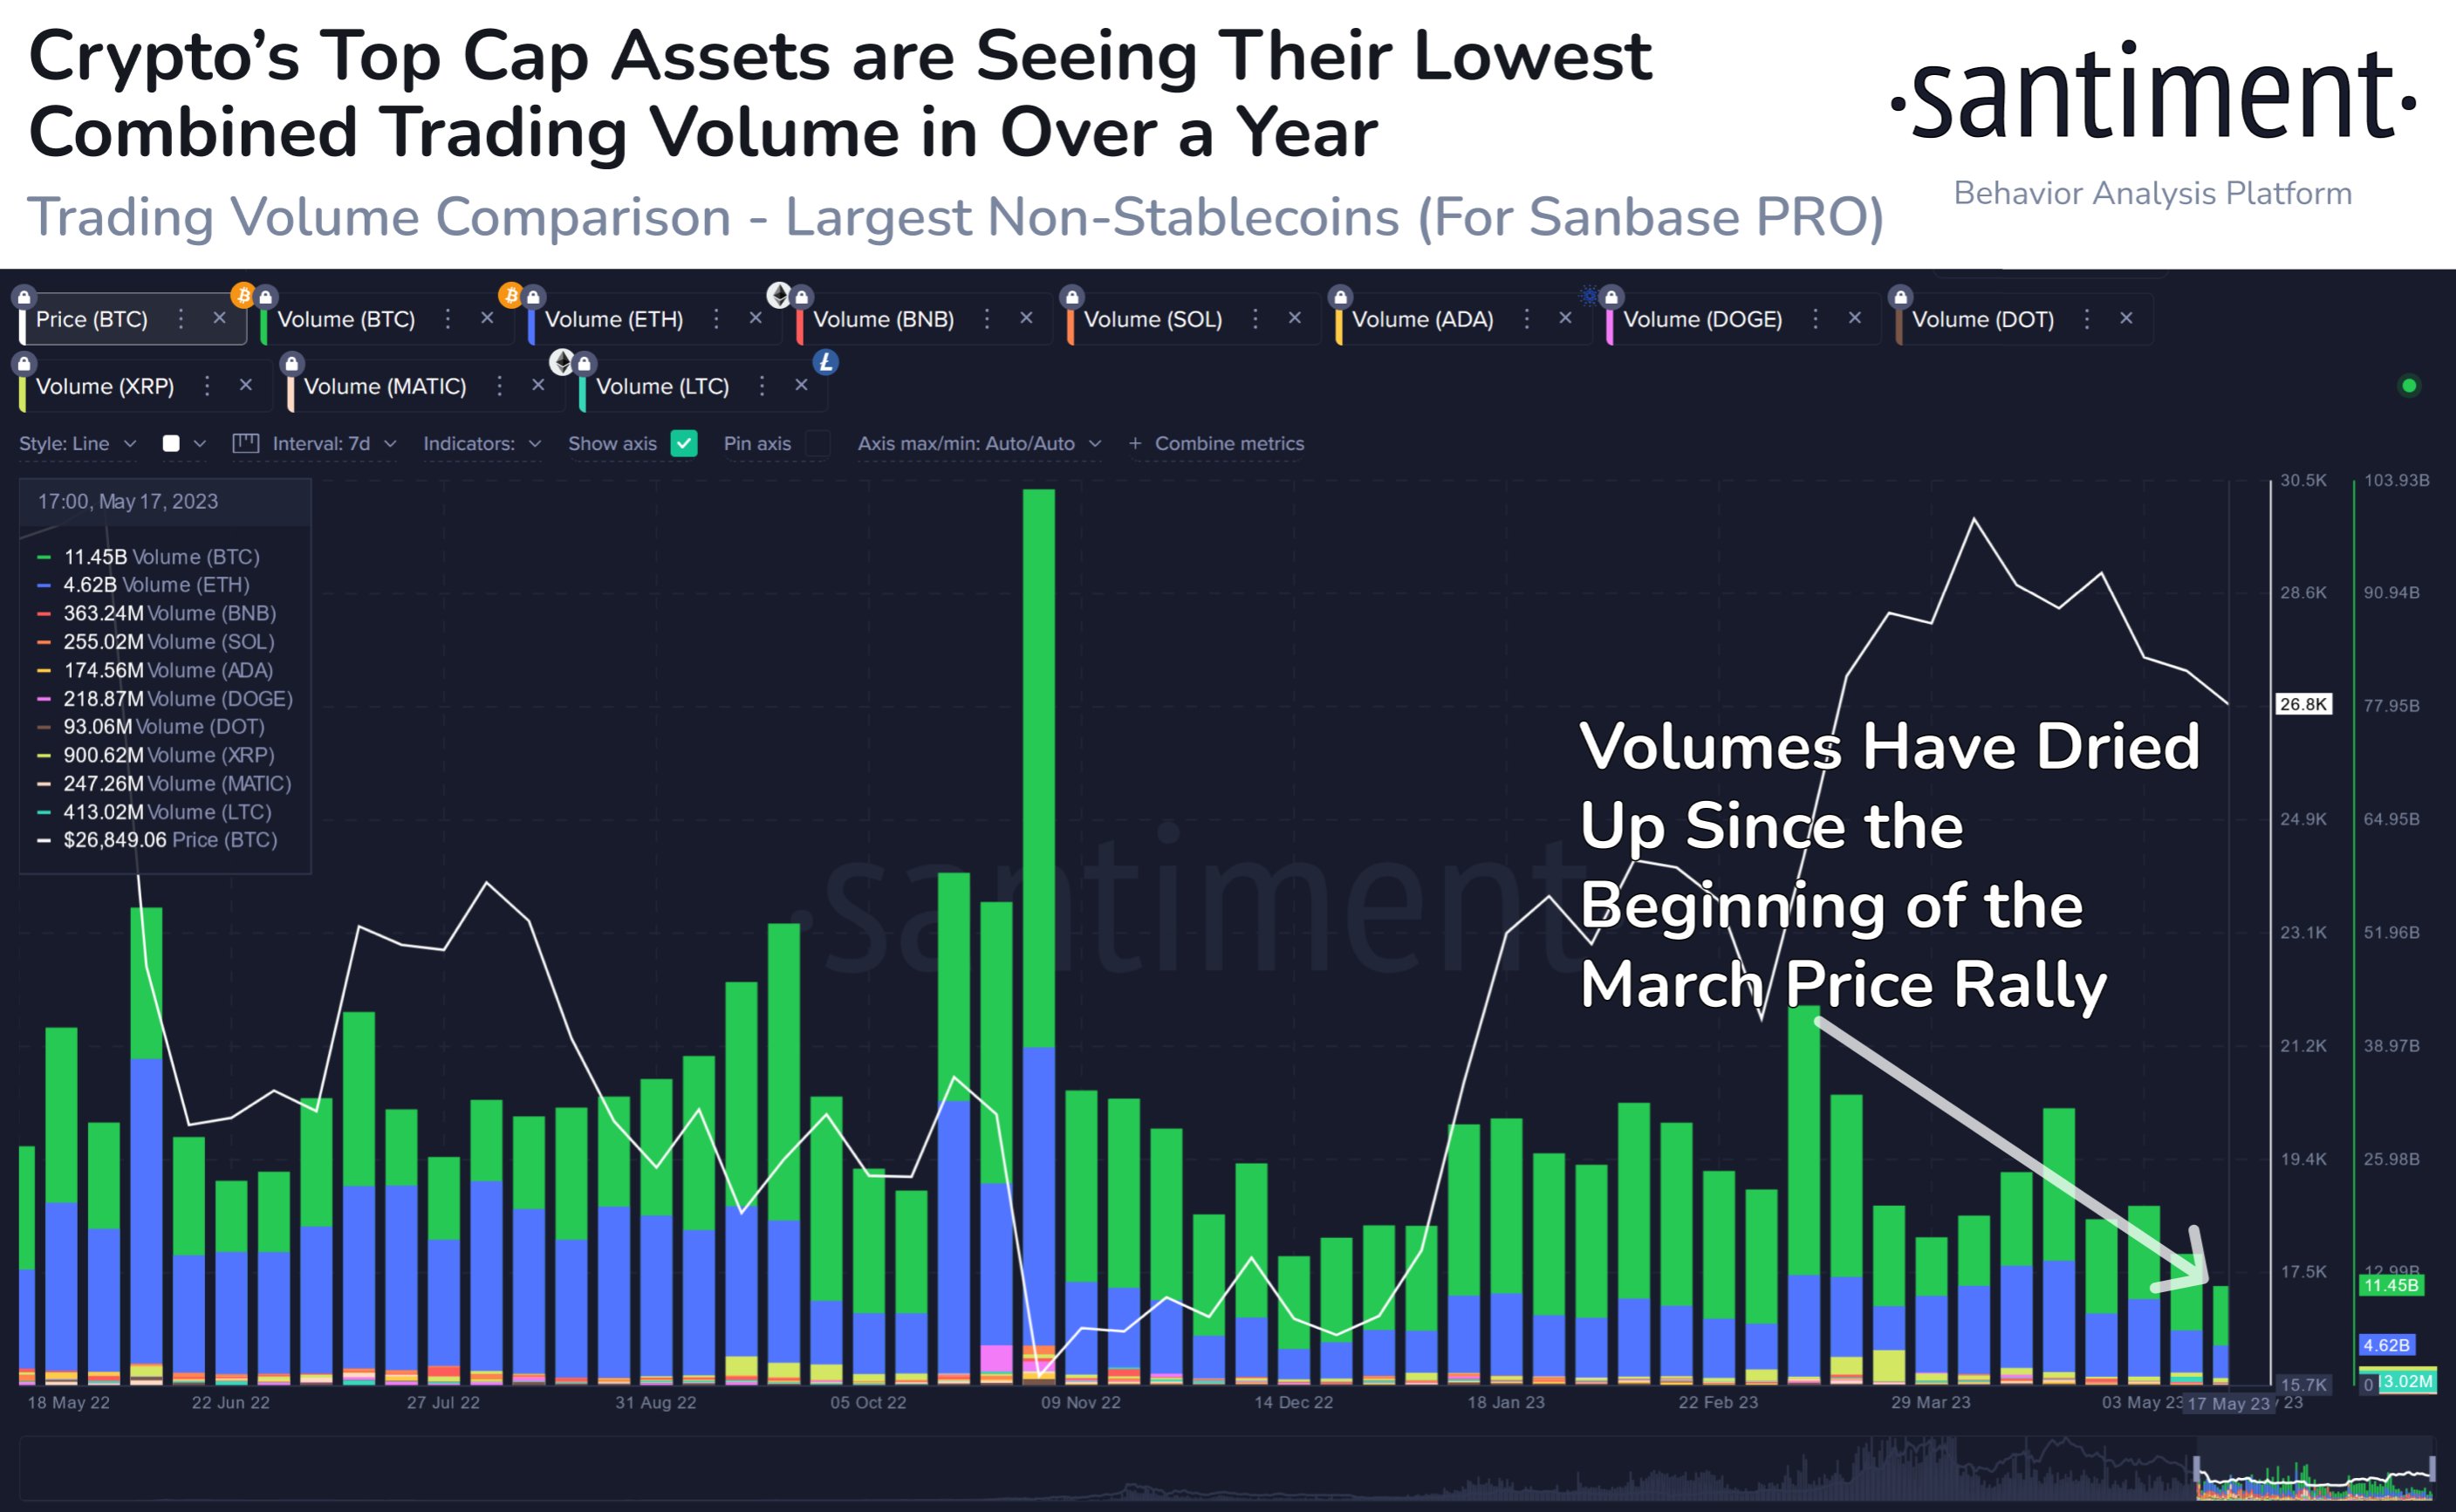
Now, here is a chart that shows the trend in the 7-day trading volume for some of the largest assets by market cap in the sector over the last year:
As you can see in the above graph, the combined 7-day trading volume of these top assets surged back in March when Bitcoin and other coins had observed a sharp rally out of a local bottom.
Since then, however, the indicator has seen an overall downtrend, and now the metric has hit some pretty low values. This means that during the last seven days, the assets have observed transactions of a very little amount.
The current combined trading volume for these large cap assets is in fact the lowest it has been since more than a year ago. From the chart, it’s visible that out of these coins, only Bitcoin (highlighted in green) and Ethereum (colored in blue) have any appreciable volumes still left.
The indicator’s value for the altcoin market has always been pretty low in comparison to Bitcoin and Ethereum, but recently, it has seen the trading volumes really dry up.
Naturally, the current low volumes throughout the top assets might suggest that there isn’t much interest in trading cryptocurrencies left among the general investor.
Generally, sharp price action such as a rally or a crash attracts a high number of users to the market because such moves are generally exciting to them. Such moves are also only sustainable if they can continue to bring attention to the cryptocurrency, as a large number of traders are needed to fuel moves of this kind.
Moves that fail to amass any significant attention, however, eventually end up dying out. Because of this reason, the latest low volumes can be a worrying sign for the sustainability of the rally in the prices of Bitcoin and other assets.
BTC price
At the time of writing, Bitcoin is trading around $27,300, up 1% in the last week.


