It may seem like Bitcoin has seen intense volatility over the past two weeks, and that’s true.
In the past week alone there was approximately $250 million worth of position liquidations on BitMEX alone, data from crypto derivatives platform Skew.com shows. And in the entire cryptocurrency market, there were likely hundreds of millions more.
Yet from a macro perspective, this has been all but consolidation.
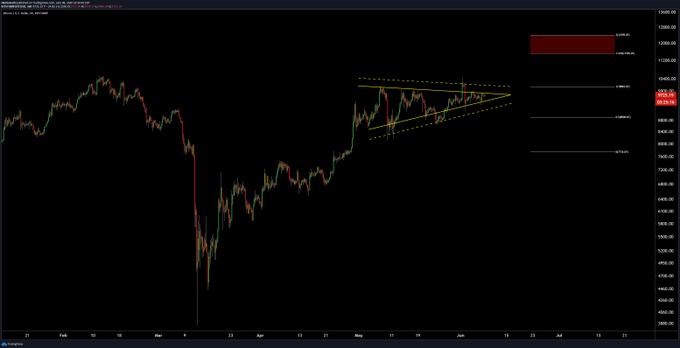
Brave New Coin’s Josh Olszewicz shared the chart below on June 8th, showing that the price action over the past five weeks has seen Bitcoin consolidate into a tight triangle pattern.

Prices could break either way as it’s a textbook symmetrical triangle, yet analysts are betting on upside. Here are a number of reasons why.
Bitfinex Order Book Favors Bitcoin Bulls
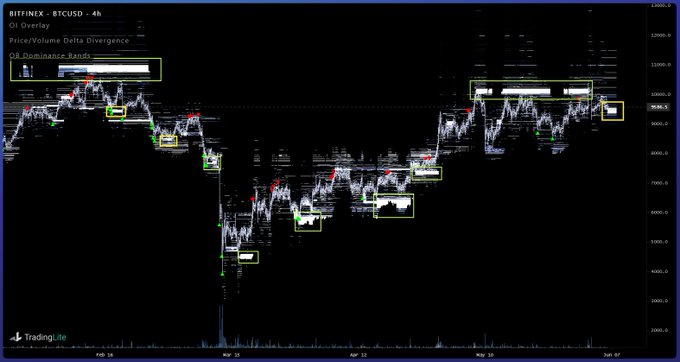
A prominent cryptocurrency trader shared the chart below this weekend. It shows Bitcoin’s price on Bitfinex alongside the Order Book Dominance Bands indicators, which is a heatmap that paints the buy-side and sell-side orders of a market on the chart.
The chart is relevant because the aggregate crypto investor recently started bidding the $9,500 region heavily.
As the Dominance Bands last printed such strong order book support when the asset was trading in the $6,000s and $7,000s, it suggests that Bitcoin is going to move higher in the coming weeks.

Bitcoin Miners Are Bullish Once Again
Bitcoin miners are rapidly upgrading their hardware and turning on mines despite the block reward halving last month.
There’s been such a high amount of activity amongst miners that according to Bitcoin data analyst Digitalik.net, blocks are being mined at their fastest rate since June 2014.
We are currently in the fastest difficulty era since jun 2014.
Current block interval 8min 5sec.#bitcoin #btc #halving #stocktoflow
— digitalik.net (@digitalikNet) June 7, 2020
Analysts say this is bullish for BTC because it shows that the “miner capitulation” that analysts feared is already over or didn’t even take place. As Blockware Mining’s Matt D’Souza explained:
“S9s/mid gen are getting swapped out for next gen. Luckily, the manufacturers didnt accurately forecast. Next gen is sold out through October. […] There are 2 types of significant difficulty drops & I don’t consider them both miner capitulation: price induced and halving induced.”
Stocks Continue to Rip Higher, Boosting Crypto Assets
Despite the 40 million unemployment claims in the U.S., the stock market has continued to rip higher. Prices are nearing all-time highs once again for some equities, while others have already established fresh highs on the back of trillions of dollars worth of stimulus.
Although some say that Bitcoin is entirely uncorrelated with the stock market, it’s hard to argue that booming equities don’t push the cryptocurrency market higher with it.
Hence, should equities continue higher, the BTC market will continue to experience the proverb “all ships rise with the tide.”
Featured Image from Shutterstock
Price tags: xbtusd, btcusd, btcusdt
Bitcoin Is About to See a Crucial Breakout: 4 Factors Show Upside Is Likely


