Bitcoin has finally begun to strongly recover since last week’s lows near the $16,200 region. In the past 48 hours, the coin surged from the $17,000 region to $18,500 — the highest the coin has traded at in many days.
Analysts are mixed over what comes next for Bitcoin. Some think that this rally is a precursor to new highs. Others think that the coin could revert lower as it faces down key resistance levels.
Bitcoin Is Facing Down a Key Resistance Region: Analyst
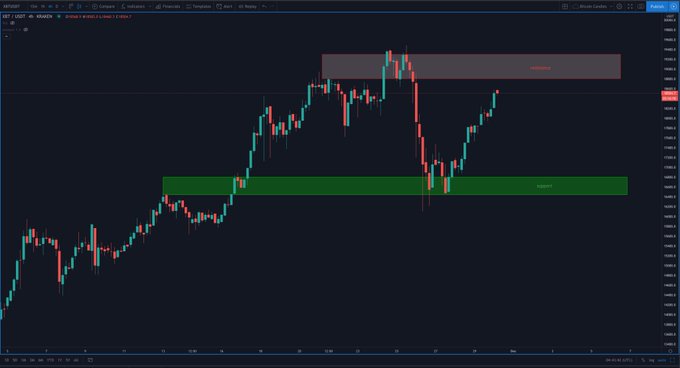
One trader recently noted that the cryptocurrency is running up against a key resistance region, which may trigger further losses.
The analyst, Tyler D. Coates, shared the chart seen below on November 29th. The chart shows that after bouncing off the support in the $16,500 region, it is facing down a macro resistance level in the $19,000s. This is close to where Bitcoin topped in 2017’s bull market, making it a level of importance for many now.
Chart of BTC's price action over the past few weeks with an analysis by crypto trader Tyler D. (Saw Cruh Teez) Coates (@Sawcruhteez on Twitter)
Source: BTCUSD from TradingView.com
Analysts Become Bearish
This chart was shared as a number of other analysts have become bearish, focusing on technical trends.
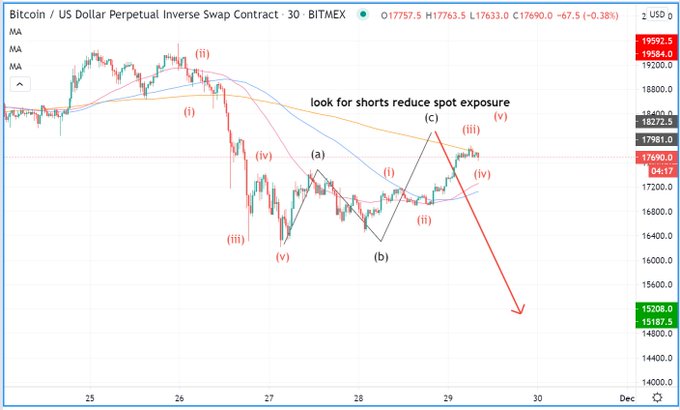
A historically accurate analyst that in the middle of 2018 predicted that Bitcoin would drop to $3,200 to bottom recently said:
“you love to see it, looking for another pop higher into 18k before opening some shorts. to me this is a clear abc up after a 5 wave decline, and complacency looks to be kicking in.”

Chart of BTC's price action over the past week with an Elliot Wave analysis by historically accurate analyst Benjamin (@SmartContracter on Twitter)
Source: BTCUSD from TradingView.com
Of note, many are sure that the fundamentals of the space are strong despite the strong correction.
Commenting on how the recent drop reset the overheated futures market, Bitcoin on-chain analyst Willy Woo commented that he is maintained a bullish tone:
“Margin longs will be spanked until they go short. Was bullishness was way overheated. Exchange flows are neutral; spot sellers are matched with buyers. Fundamentals a great. The next few weeks? A great time to scoop cheap coins for 2021.”
Many are confident that with the entrance of institutional players, Bitcoin will move higher over time. This is based on the belief that institutional demand will outweigh natural selling pressure via sellers and miners.
Featured Image from Shutterstock
Price tags: xbtusd, btcusd, btcusdt
Charts from TradingView.com
Analysts Think Bitcoin is Running Up a Key Resistance Level


