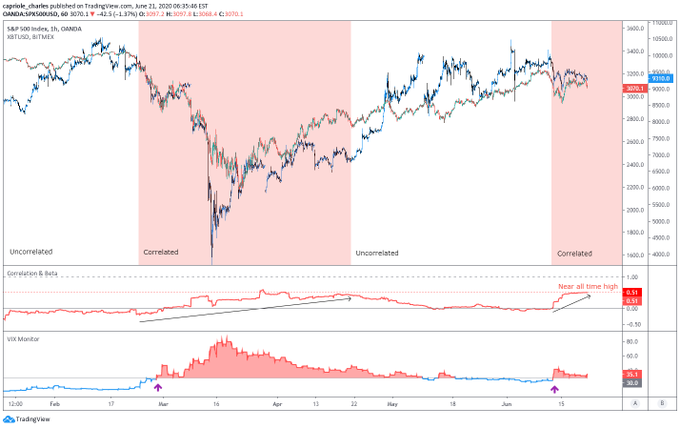
Save for a few blips here and there, Bitcoin has more or less tracked equities over recent months. The below image from Charles Edwards, a digital asset manager, shows this correlation quite well.

The correlation between crypto and the S&P 500 has also been tracked by analysts at JP Morgan. The strategists at the bank said that “Cryptocurrencies have traded more like risky assets like equities—a significant change relative to the prior couple of years.”
According to the trader that predicted at which point Bitcoin would bottom in 2018, this correlation could result in a BTC decline.
Bitcoin Is “Cooked”: Analyst Says
There’s a sentiment spreading amongst investors in Bitcoin that the recent stagnation is bullish.
Investors touting this theory cite Wyckoff schematics — charts on patterns observed by the late technical analyst Richard Wyckoff. Specifically, they point to Wyckoff Re-accumulation schematics, which are patterns seen in the middle of an asset’s uptrend.

Yet, the recent price action may be anything but that.
Six months prior to Bitcoin bottoming 2018’s bear market at $3,150, an analyst speculated that $3,200 would be the bottom price.
That same analyst now says that “Equities and BTC both look cooked. This is not re-accumulation, sorry.”
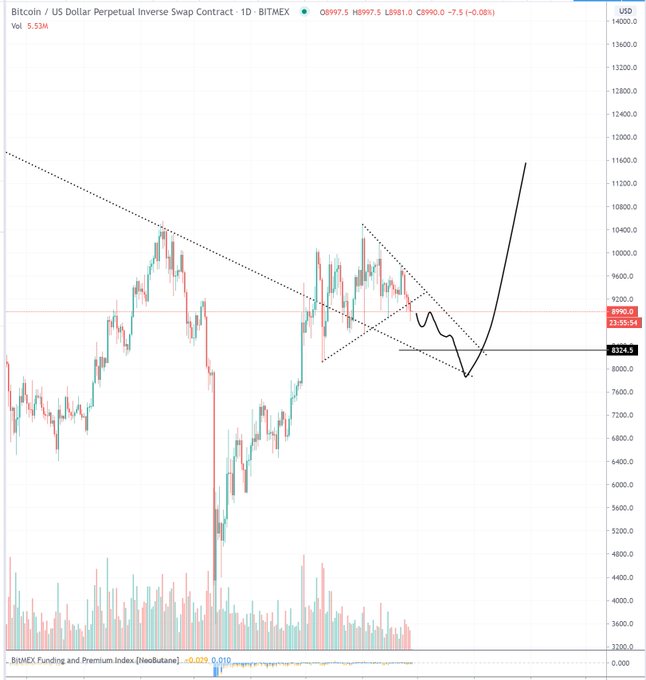
This comment is in line with his previous analyses of Bitcoin. Attached to the chart below, which predicts BTC will fall towards the mid-$7,000s before rebounding, he wrote:
“It’ll be time to buy btc when all the “relax guys, its still ranging” people admit this is distribution and turn bearish.”

The S&P 500 Is Reaching “Bubble” Territory
Core to his thesis is that the S&P 500 is also bearish, not just Bitcoin.
According to multiple analysts, that assertion is correct to make.
The chief investment officer at Minneapolis-based Leuthold Group told Bloomberg that a 20% drop could take place in the weeks ahead. Doug Ramsey said on the matter:
“The bulls could be proved right in that the March 23rd low holds, but you could lose a lot of money in a drawdown here… You could still very easily have a drop of 20% from the peak we made on June 8th. Very easily.”
There have also been bearish thoughts shared by Jeremy Grantham, a stock analyst that predicted three previous stock market tops. He recently told CNBC that a potential “bubble” is forming as market conditions get “crazy.”
This comment was made in reference to the relative overvaluation of companies compared to where valuations were earlier this year.
"This is really the real McCoy," says legendary investor Jeremy Grantham on whether the recent rally is a sign of a bubble to come. "This is crazy stuff." pic.twitter.com/XetUBqqPBk
— CNBC's Closing Bell (@CNBCClosingBell) June 17, 2020
Featured Image from Shutterstock
Price tags: xbtusd, btcusd, btcusdt
Analyst That Predicted 2018's $3k Bottom Says Bitcoin Looks "Cooked"


