- Bitcoin has begun to surge higher again after multiple days of consolidation under $16,000.
- The coin traded as high as $16,500 earlier today.
- Analysts are not yet convinced it’s clear skies for Bitcoin, though.
Bitcoin Could Surge Towards $20,000 Once $17,000 Is Claimed
Bitcoin has begun to surge higher again after multiple days of consolidation under $16,000. Hours ago, the leading cryptocurrency moved from the $15,900 resistance it was trading near toward $16,500.
Analysts are not yet convinced it’s clear skies for Bitcoin, though. This comes in spite of some sentiment shared that there is no serious technical resistance from here until $20,000.
The leading cryptocurrency currently trades below a number of important daily levels that acted as support and resistance during the 2017 and early 2018 rally.
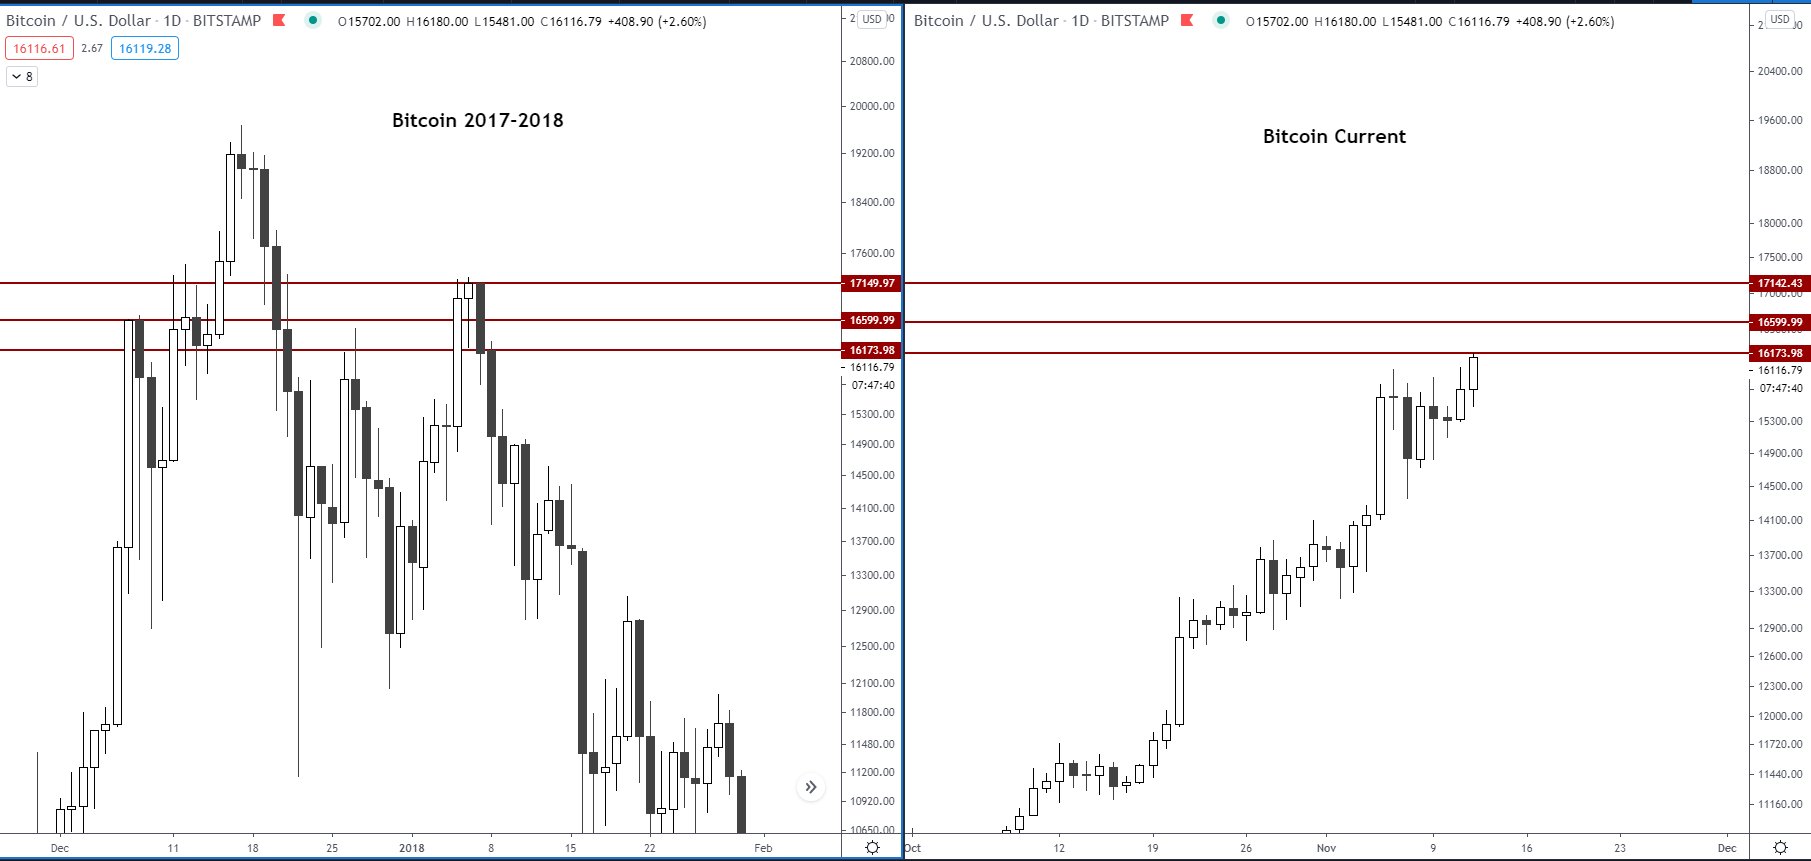
Crypto-asset analyst Josh Rager recently shared the two charts seen below. On the left is Bitcoin’s one-day chart from late-2017 and early-2018, and on the right is BTC’s daily chart over the past few weeks.
The chart depicted on the left shows that Bitcoin interacted with three levels on multiple occasions during the rally of late-2017 and early-2018: $16,173, $16,600, and $17,150.
The chart on the right shows that Bitcoin is currently approaching these technical levels. Considering their historical importance, there is a high likelihood they will act as resistance for the cryptocurrency moving forward. As Rager explained:
“Keep an eye on these key Bitcoin price levels (daily/weekly) from the 2017-2018 highs They could likely reject before moving higher But after $17,149, there isn’t a lot standing in the way before $19,000+.”
Chart of BTC's price action over the past few weeks with a comparative analysis to 2017 with analysis by crypto trader Josh Rager (@Josh_Rager on Twitter).
Source: BTCUSD from TradingView.com
New All-Time Highs Imminent
Analysts say that Bitcoin will soon hit new all-time highs.
Tyler Winklevoss, CEO of Gemini and a Bitcoin billionaire with his twin brother Cameron, recently stated:
“I do think we will see an all-time-high price for #Bitcoin before 2020 is over. Even though the price has climbed from 10k to almost 14k in less than a month, it hasn’t really gone on a breakout run yet. When we start to see 3-5k surges then the bulls will be on the run.”
Winklevoss was recently quoted as saying that Bitcoin could hit $500,000 in the years ahead. Such a rally would give the cryptocurrency a higher market capitalization than gold has today.
He thinks that Bitcoin will achieve such a rally due to the immense buying pressure that will take place due to monetary inflation. The Winklevoss twin added that the cryptocurrency is fundamentally better than the leading precious metal, which should aid a rally.
Featured Image from Shutterstock
Price tags: xbtusd, btcusd, btcusdt
Charts from TradingView.com
After $17,150 Turns Into Support, Bitcoin Could Surge Toward $20,000


