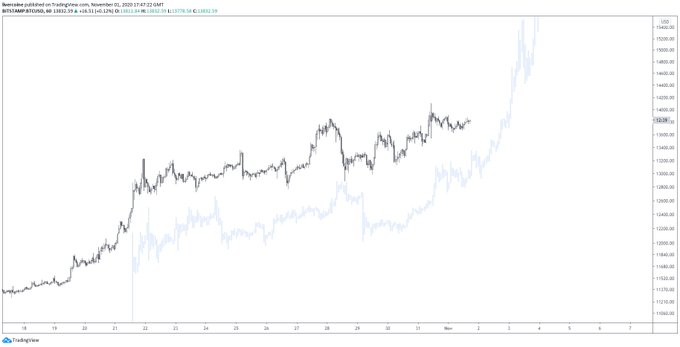
- Bitcoin has undergone a strong rally over the past two weeks, rallying to $13,800.
- This consolidation may soon end, fractals suggest.
- These fractals showed that BTC will enter a parabolic surge higher that will likely bring it towards $15,000.
- Assuming the fractal plays out to a T, this rally could begin as soon as tomorrow.
Bitcoin Likely to Continue Higher, Fractal Predicts
Bitcoin has undergone a strong rally over the past two weeks. The coin currently trades for $13,800, almost 25% higher than the $11,200 lows set after news broke about OKEx’s withdrawals.
The leading cryptocurrency is currently stagnating in the high-$13,000s after it failed to hold $14,000 on Saturday. Price action is neutral in the medium term, with the futures market viewing it as such.
This consolidation is expected to end soon, though.
One crypto-asset analyst shared the chart below, which shows Bitcoin’s price action over the past few weeks with price action from 2019 overlayed. This fractal analysis indicates that the consolidation will soon end and BTC will enter a parabolic surge higher that will likely bring it towards $15,000.
Assuming the fractal plays out to a T, this rally could begin as soon as tomorrow.
Chart of BTC's price action over the past few weeks with anaylsis by crypto trader Livercoin (@Livercoin On Twitter).
Source: BTCUSD from TradingView.com
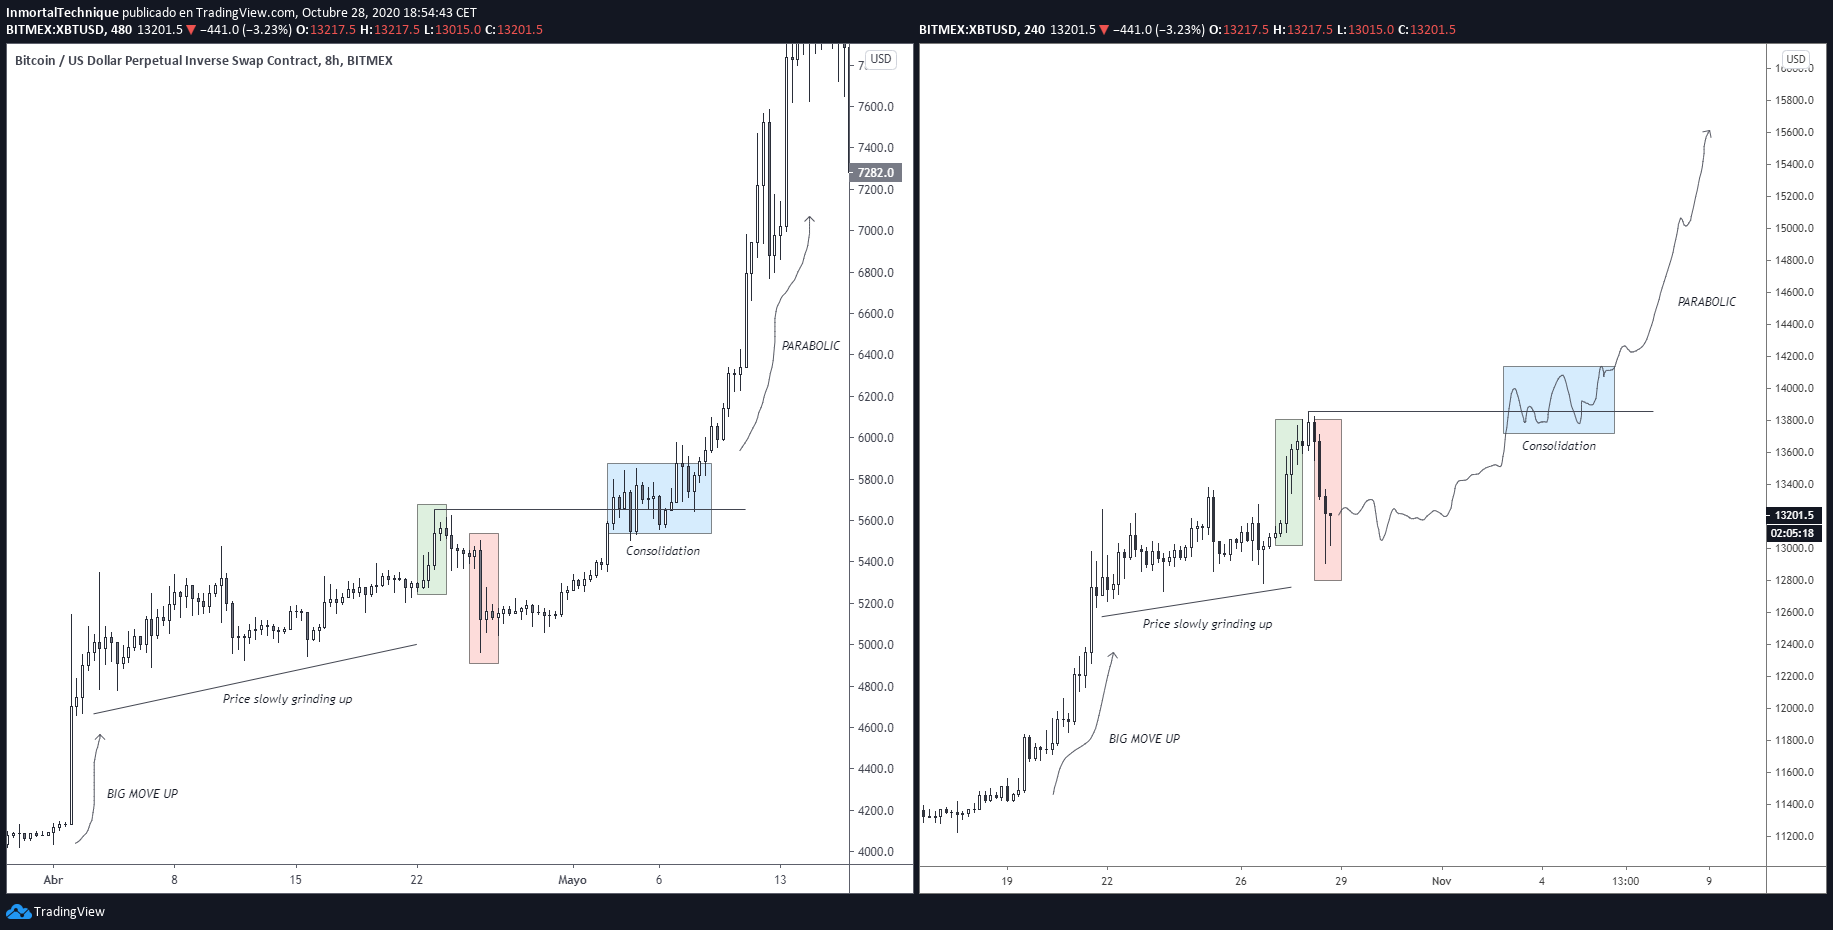
Another analyst has brought attention to a similar fractal on their own Twitter feed. This other analyst shared the chart below on October 28th, prior to BTC piercing $14,000 on Saturday morning.
This fractal indicates that Bitcoin could soon go parabolic towards $16,000 once $14,000 is turned into support. $14,000 has long been an important price level for Bitcoin, marking the highs of multiple previous rallies.
Chart of BTC's price action over the past few weeks with anaylsis by crypto trader Inmortal Technique (@inmortalcrypto On Twitter).
Source: BTCUSD from TradingView.com
Monthly Close Worries Some Analysts
Despite the strong technical signs and the recent rally, analysts are worried that Bitcoin’s price action is not yet decisively bullish. The monthly candle close came in on Saturday evening.
While Bitcoin did post its second-highest monthly close ever (only second to December 2017), the price failed to pass $14,000. In fact, it wicked above $14,000, then closed under it, forming an “SFP” candle at a critical resistance.
Some fear that this failure to hold $14,000 will result in months of consolidation that means it will slide back towards the $10,000 region. Multiple analysts have shared these fears but as it stands, bulls seem to still be in control.
Featured Image from Shutterstock
Price tags: xbtusd, btcusd, btcusdt
Charts from TradingView.com
2019 Fractal Predicts Bitcoin's 25% Rally Will Continue to Gain Steam


